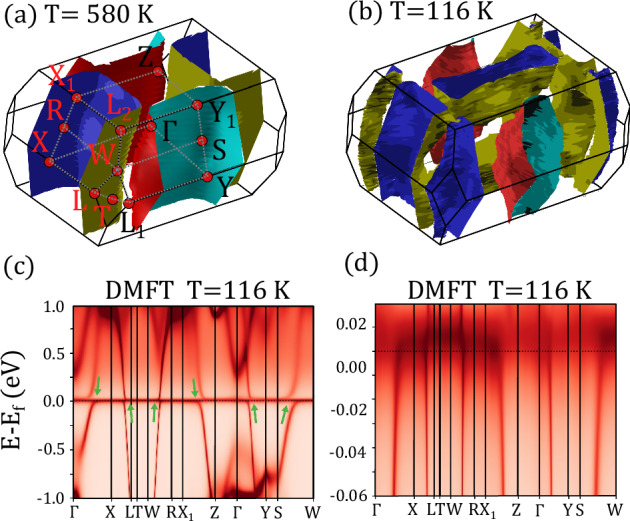
Fig. 5. Fermi surfaces calculated from DFT+DMFT as described in the text at high temperature T = 580 K and low temperature T = 116 K.

The high temperature calculation is shown in (a) and the low temperature in (b). The calculated low temperature electronic disperison throughout the full Brillouin zone is shown in (c), with the low energy scale most relevant to the quasiparticle excitations shown in (d). The green arrows in (c) highlight the anticrossings in the quasiparticle band structure that originate from f-band correlations.
