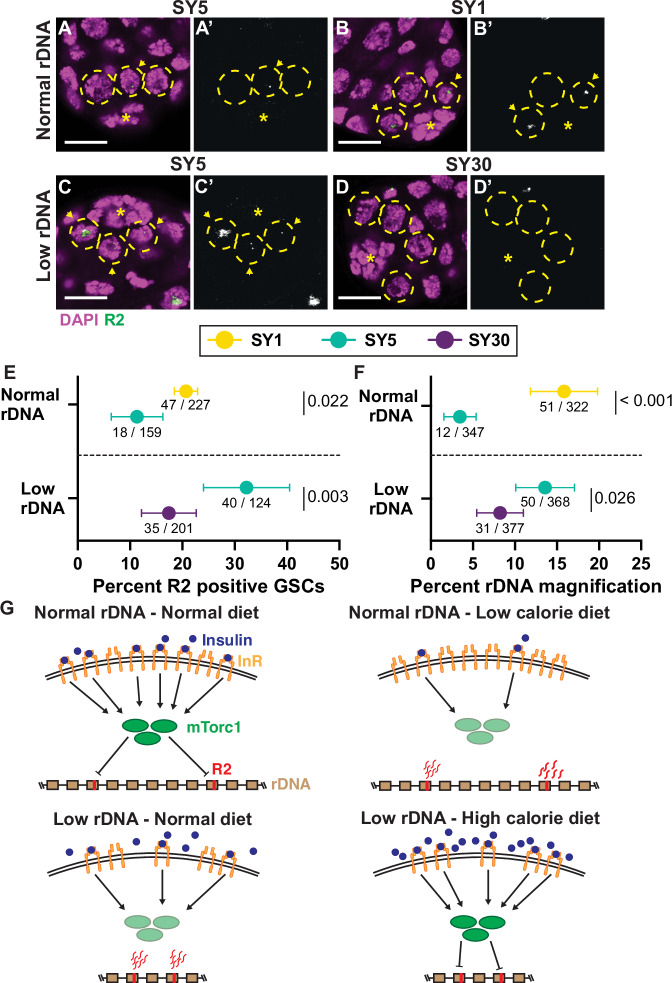
Fig. 4. Dietary conditions alter germline R2 expression and rDNA magnification activity.
A–D Images of R2 FISH in testes of low and normal rDNA CN. DAPI in magenta and R2 in green. A’–D’ is the R2 channel only. All images are to scale. Scale bar: 10 µm. E Percent R2 positive GSCs in males with low or normal rDNA CN on low and high-calorie diets. F Percent offspring with wild-type cuticles in rDNA magnification assay of from males with normal or low rDNA CN fed on low and high-calorie diets. For E, F, data presented is the percentage of total GSCs expressing R2 (E) or total animals exhibiting wild-type cuticles (F), with source data listed below, and ±95% CI. The p-value is determined by a two-sided chi-squared test, and the SY5 diet is the control condition for all experiments. p = 9.01 × 10⁻⁸ for percent rDNA magnification between normal rDNA SY1 and SY5 G Model of dietary impact on rDNA copy number regulation through InR. Under conditions of normal rDNA copy number and normal diet (top left), activated insulin receptors in GSCs stimulate mTORC1 activity, which represses R2 expression. Low-calorie diets (top right) reduce insulin signaling, limiting mTORC1 stimulation, relieving R2 repression, and allowing for R2 to stimulate rDNA copy number expansion. When rDNA copy number is low under normal conditions (bottom left), reduced expression of the insulin receptor in GSCs also reduces mTORC1 activation, leading to R2 expression that stimulates rDNA copy number expansion. When high-calorie diets increase insulin stimulation in low rDNA GSCs (bottom right), the increased insulin signaling activates mTORC1 sufficiently to suppress R2 expression and limit rDNA copy number expansion activity. Genotypes: bbZ9/Ybb+;; nos-Gal4/ + (Normal rDNA), bbZ9/Ybb0;; nos-Gal4/ + (low rDNA). Source data are provided as a Source Data file.

