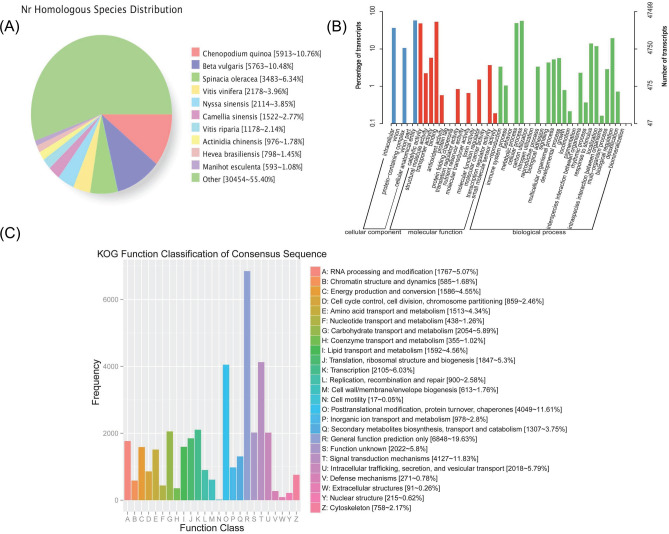
Fig. 3.
The functional annotation results of the full-length transcripts of A. bracteata. (A) Statistical diagram of species classification annotated with NR of the full-length transcripts. Different colors represented different species. (B) Statistical diagram of GO annotation classification of the full-length transcripts. The horizontal axis represented GO classification, the left side of the vertical axis represented the percentage of transcripts, and the right side represented the number of transcripts. (C) Statistical diagram of KOG annotation classification of the full-length transcripts. The horizontal axis represented the classification content of KOG, and the vertical axis represented the number of transcripts.

