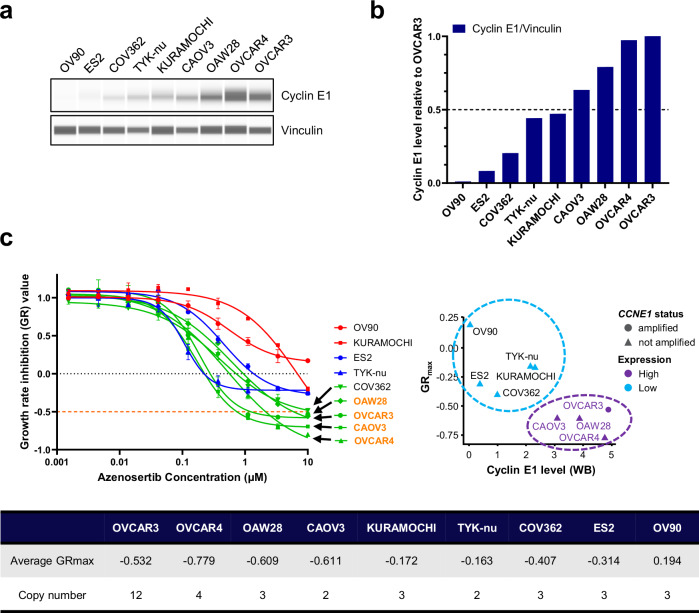
Fig. 1. Cyclin E1high HGSOC cell lines are more sensitive to azenosertib in vitro.
a Jess analysis showing cyclin E1 expression level in nine high-grade serous ovarian cancer (HGSOC) cell lines. b Quantification of Cyclin E1 level normalized by Vinculin using densitometry. c CellTiter-Glo (CTG) assay to evaluate the growth rate inhibition (GR) performed on nine HGSOC cell lines grown in 2D culture conditions in a 3-day assay. GR and GRmax were determined by measurement of cell viability before and after 72 hours treatment of azenosertib and the GR calculator (http://www.grcalculator.org). (left) The GR values were generated in at least two independent experiments. The representative GR curve is shown. (right) The GR plot in combination with Cyclin E1 expression level showing the correlation of the level of Cyclin E1 and cytotoxic effect (lowering GRmax). (bottom) Summary of the average GRmax and the copy number of nine HGSOC cell lines used in the study.

