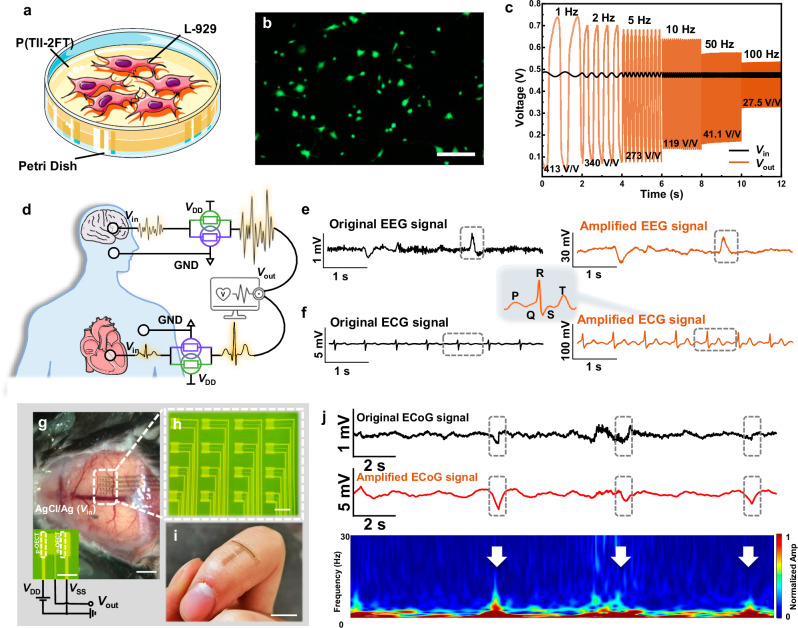
Fig. 5. Biosignal amplification using P(TII-2FT)-based amplifiers.
a Schematic illustration of cell viability tests on P(TII-2FT) film. b Live (green fluorescence)/dead (red fluorescence) staining of mouse fibroblasts (L929) on P(TII-2FT) film (scale bar: 100 μm). c Dynamic response of the amplifier using small sinusoidal signals at different frequencies. The corresponding gains at different frequencies are also displayed. d Schematic illustration of the vOECT amplifier for recording (e) EEG and f ECG signals. g Photograph of in vivo ECoG recording and schematic of the electrical wiring (scale bar: 2 mm, inset: 100 μm). h Microscopic image of the amplifier array (scale bar: 200 μm). i Photograph of an ultrathin (10 μm) and flexible amplifier array attached to a finger joint (scale bar: 1 cm). j The ECoG signals of the cortex in vivo recorded by a metal electrode or a P(TII-2FT) amplifier. The time-frequency analysis diagram of the signal from the amplifier. In the ECG, EEG, and ECoG signals, the black lines represent the electrode-collected signals, and the orange lines represent the signals from our amplifier. Panel a was partly generated using Servier Medical Art under a Creative Commons Attribution 3.0 unported license.

