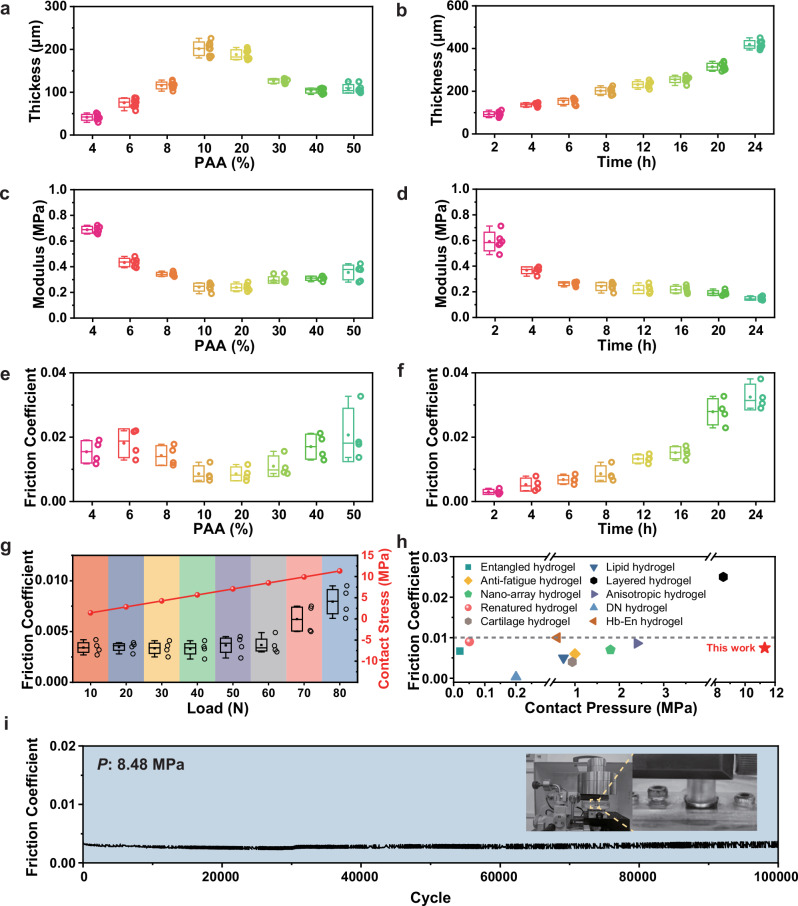
Fig. 3. Control of the dissociation-layer thickness, mechanical strength and lubrication performance of SLH.
a Evolution of the dissociation layer thickness with the PAA concentration at a certain treatment time of 8 h. b Evolution of the dissociation layer thickness with the PAA treatment time at a certain concentration of 10%. c Evolution of the dissociation-lubrication layer modulus with the PAA concentration at a certain treatment time of 8 h. d Evolution of the dissociation-layer modulus with the PAA treatment time at a certain concentration of 10%. e Evolution of the surface friction coefficient for the dissociation layer with the PAA concentration at a certain treatment time of 8 h. f Evolution of the friction coefficient for the dissociation layer with the PAA treatment time at a certain concentration of 10%. g Changes in the surface friction coefficients and contact stresses for the dissociation layer under different normal loads. h Comparisons of the friction coefficient and contact pressure between the reported lubricous hydrogels and those used in this work. i Real-time and long-period (100,000 cycles) friction coefficient curve for the SLH sample under a high contact pressure of 8.48 MPa (treatment time: 2 h, PAA concentration: 10%). Note: for all box plots, the horizontal line within box represents the data value located in the middle sequence number, the upward bar represents the maximum data value and the downward bar represents the minimum data value, solid dot within box represents the average value.

