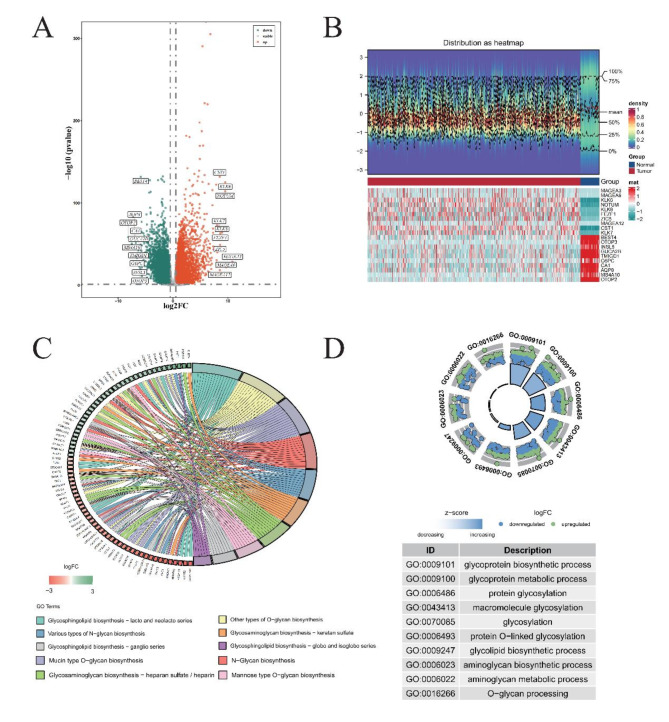
Fig. 1.
Refined annotations for comprehensive gene expression analysis in COAD. (A) Identification of Differentially Expressed Genes (DEGs) in TCGA-COAD Dataset. Red dots signify genes that have undergone significant up-regulation, while green dots correspond to those experiencing down-regulation. (B) Heat Maps Depicting Top 10 DEGs. Blue represents samples from the Normal cohort, whereas red stands for Tumor specimens. Below, the heat map’s lower section uses cyan to represent genes showing decreased expression, juxtaposed with red highlighting those exhibiting up-regulation. (C) KEGG Pathway Enrichment Analysis. On the right, diverse colors code for various KEGG enrichment pathways, revealing the complex interplay of biochemical processes affected. To the left, green denotes genes whose expressions have been down-regulated, with red indicating their up-regulated counterparts. (D) Gene Ontology (GO) Enrichment Analysis. The inner circle portrays the number of genes clustered under specific GO terms, acting as a visual metric for functional grouping. Outside the circle, individual dots embody single genes, where green signifies up-regulated status, and blue points to down-regulated states.

