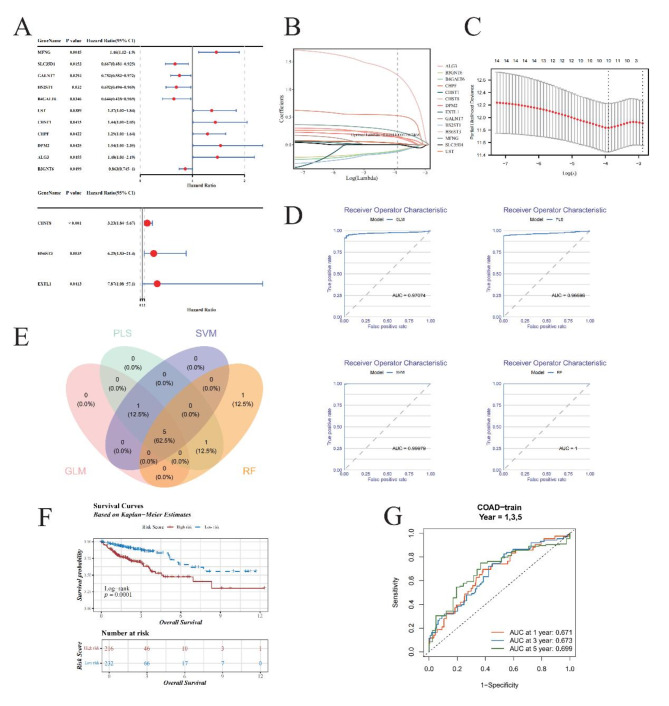
Fig. 2.
Advanced prognostic gene analysis and machine learning model evaluation in oncological research. (A) Univariate Cox Regression Forest Plot. The forest plot illustrates the outcome of univariate Cox regression analysis applied to 110 candidate genes, identifying 14 potential prognostic genes (GRGs). Among them, 5 genes exhibit hazard ratios (HR) less than 1, suggesting protective roles, while 9 others are identified as risk factors, reflecting their detrimental impact on patient outcomes. (B,C): Least Absolute Shrinkage and Selection Operator (LASSO) Regression. (B) Each colored line represents a unique gene, showcasing its coefficient profile during LASSO regularization path. The optimal lambda (λ), determined by minimizing prediction error, is visually indicated, highlighting the regularization strength that achieves the best trade-off between bias and variance. (C) The LASSO model optimized via 10-fold cross-validation. (D) Receiver Operating Characteristic (ROC) Curve Comparison. Graphical representation of ROC curves for GLM (Generalized Linear Model), PLS (Partial Least Squares), SVM (Support Vector Machines), and RF (Random Forest). (E) Venn Diagram Illustrating Overlapping Genes. Highlights the common subset of top 60% genes with the least residual errors selected by all four machine learning algorithms. (F) Kaplan-Meier Survival Analysis. The KM plot compares survival probabilities between high-risk and low-risk patient cohorts. The blue line indicates low-risk individuals’ survival rates over time, contrasted sharply by the red line representing high-risk counterparts. (G) Time-Dependent ROC Curves. Time-dependent ROC analysis for predicting OS at 1, 3, and 5 years.

