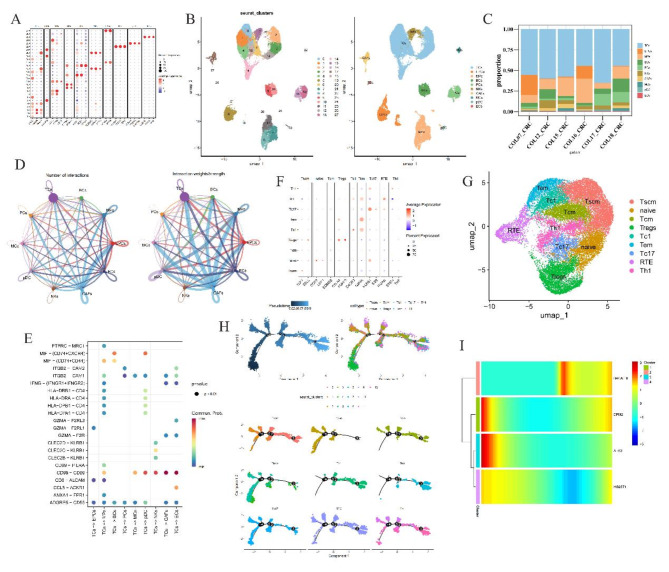
Fig. 5.
Single cell annotation and cell chat. (A) Dotplot of marker genes in different cell clusters in all samples. The dot size present percent expression and red means that the gene is high express in the cluster. (B) UMAP and cell annotation results for cell type. In left, every color present a cluter and right is the annotated results. (C) Proportion of cell numb in samples. Every color present a cell type. (D) Cell chat in the 10 type cells. The node size present the number of cell and line thickness degree present number chat (left) and strength (right), separately. (E) Receptor and ligand interaction plot, red dot present have a high interaction. (F) Marker expression in T cells subtypes. The dot size present percent expression and red means that the gene is high express in the cluster. (G) UMAP of T cell subtype annotated results, each color present a cell type. (H) T cell pseudo-time analysis results. In top left plot, dark color mean original cell. Cell differentiate from dark area to light blue area. Top right and bottom are present subtype T cells differentiation and bottom plot color present cell cluster. (I) Heat map of pseudo-time results.

