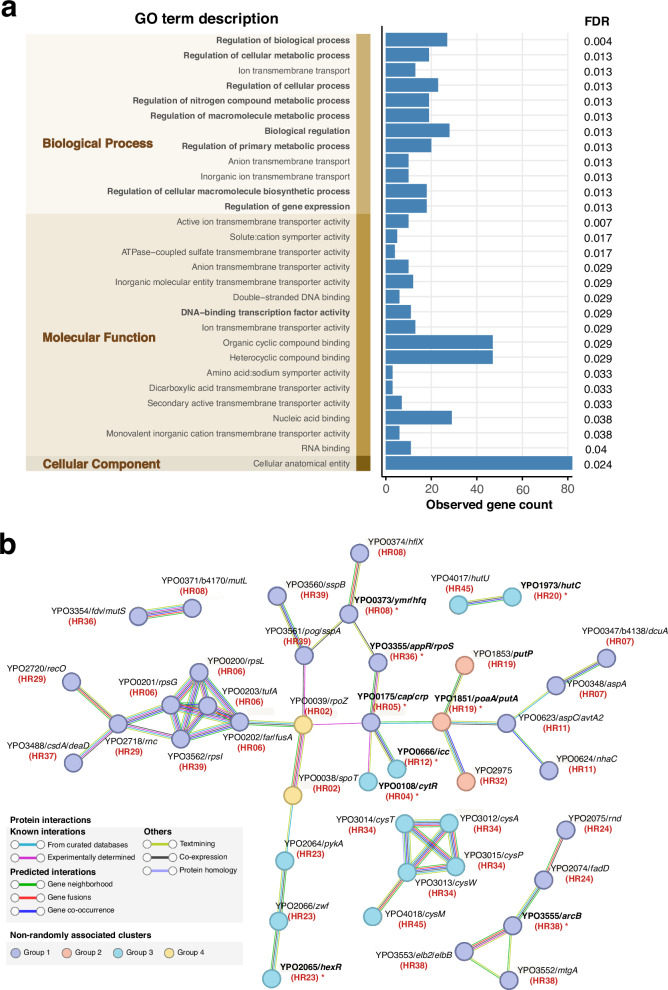
Fig. 4. Functional enrichment analysis and protein-protein interaction analysis of HR-associated genes.
a Enrichment analysis of Gene Ontology (GO) terms for 96 HR-related genes against the whole genome background. GO terms are categorized into three distinct domains, represented as vertical stacked bars and highlighted in the shaded area. Regulatory function-related GO terms are highlighted in bold text. The blue bar chart represents the observed count of HR-related genes in corresponding GO terms (noting that each gene can correspond to multiple GO terms). The false discovery rate (FDR) for significantly enriched GO terms (FDR < 0.05) are labeled in the rightmost. Source data are provided as a Source Data file. b STRING association analysis for 96 HR-related genes. Only node interactions with a confidence score greater than 0.7 are displayed, while disconnected nodes in the network are hidden and nodes connected solely through physical interactions were removed manually. Nodes are color-coded according to four clustered groups with possible epistatic signals, while connecting lines are colored based on the evidence supporting the interaction within the STRING database. Bold gene names with asterisks indicate regulatory proteins, and the red text in parentheses below the gene name indicates the HR associated with the corresponding gene.

