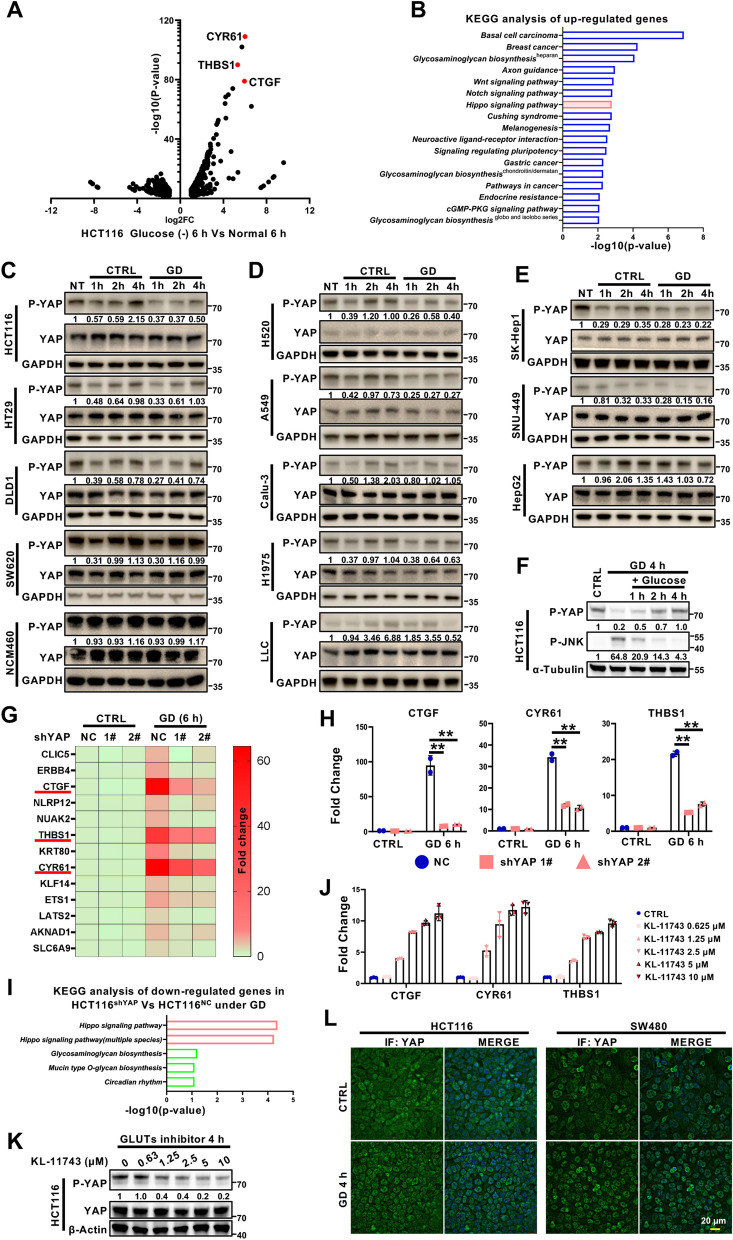
Fig. 1.
Differential responses of YAP activation to glucose deprivation in different cancer cells. A Volcano plot of the genes differentially expressed under glucose deprivation (GD). The target genes of YAP (CTGF, CYR61 and THBS1) were shown in red. B KEGG pathway enrichment analysis of genes upregulated by GD (https://david.ncifcrf.gov/). C–E Immunoblotting analysis of YAP phosphorylation (serine 127) in GD-treated colorectal cancer cells (C), lung cancer cells (D), and hepatocellular carcinoma cells (E). GAPDH was used as a loading control. F Immunoblotting of YAP phosphorylation (serine 127) and JNK phosphorylation (Threonine183/Tyrosine185) in HCT116 cells treated under GD for 4 h, and then treated with glucose for the indicated times. Tubulin was used as a loading control. G RNA-seq analysis of HCT116-shNC and HCT116-shYAP cells treated with or without GD (0 mM, 6 h). H RT‒qPCR analysis of YAP target genes (CTGF, CYR61 and THBS1) in the samples from (G). I KEGG pathway enrichment analysis of genes downregulated by YAP knockdown under GD. J RT‒qPCR analysis of YAP target genes (CTGF, CYR61 and THBS1) in HCT116 cells treated with different doses of GLUT inhibitor KL-11743. K Immunoblotting analysis of YAP phosphorylation (serine 127) in HCT116 cells treated with different doses of GLUT inhibitor KL-11743 for 4 h. Actin was used as a loading control. L Immunofluorescence staining of YAP localization in HCT116 cells or SW480 cells treated with or without GD (0 mM, 4 h). DAPI served as the nuclear stain. The experiments in (C), (D), (E), (F) and (K) were repeated twice independently. In (H) and (J), data are the mean ± S.D.; P values were calculated using a two-tailed unpaired Student’s t-test. **, P < 0.01

