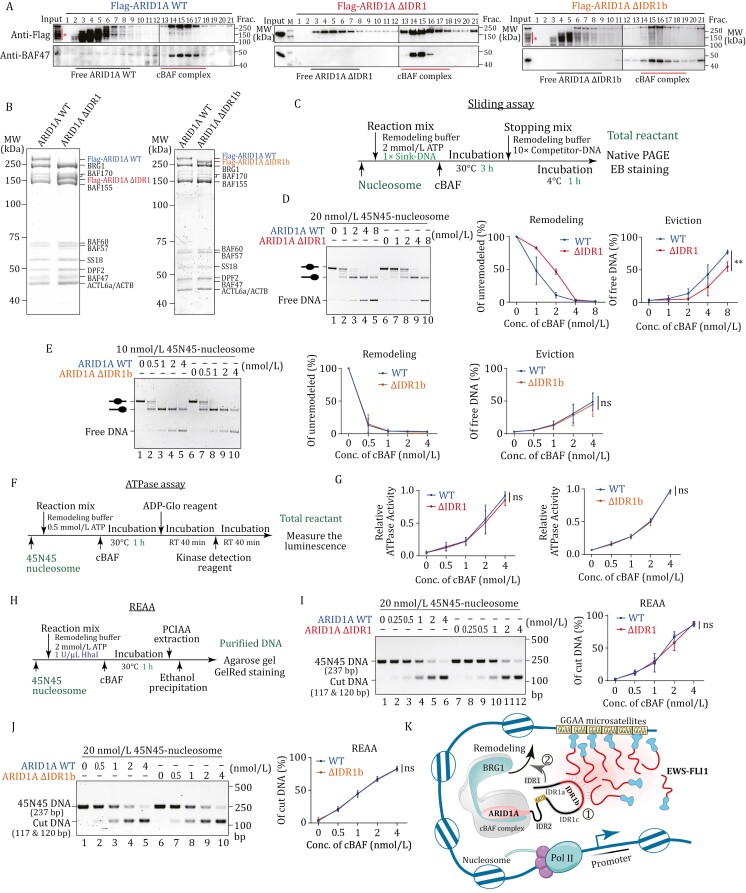
Figure 2.
ARID1A IDR1 contributes to nucleosome remodeling activity of cBAF in vitro. (A) Immunoblotting shows glycerol gradient sedimentation of Flag-purified cBAF complexes containing Flag-tagged ARID1A wild-type (right), ΔIDR1 (middle), or ΔIDR1b (left). The degradations of ARID1A WT or ΔIDR1b are indicated with stars. (B) Purified cBAF complexes containing Flag-tagged ARID1A wild-type, ΔIDR1, or ΔIDR1b are presented on SDS-PAGE and stained with Coomassie blue. (C) Workflow of the in vitro sliding assay. (D) Sliding assay and its quantification diagrams of 45N45-nucleosome and cBAF complexes containing ARID1A WT or ΔIDR1. The sliding reaction is loaded on native PAGE and stained with ethidium bromide. The remodeling diagram represents the amount of 45N45-nucleosome substrate, and the Eviction diagram represents the amount of free 45N45-DNA product. The data comprise three individual replicates and are represented as mean ± SD. The P-value is calculated by unpaired Student’s t-test. ** indicates P-value < 0.01; “ns” indicates not significant. (E) Sliding assay and its quantification diagrams of 45N45-nucleosome and cBAF complexes containing ARID1A WT or ΔIDR1b. (F) Workflow of the in vitro ATPase assay. (G) Quantification of ATPase assays with indicated concentrations of cBAF complexes. The data comprise three individual replicates and are represented as mean ± SD; “ns” indicates not significant. (H) Workflow of the in vitro restriction enzyme accessibility assay (REAA). (I) Restriction enzyme accessibility assay and its quantification diagram of cBAF complexes containing ARID1A WT or ΔIDR1. The DNA product in REAA is presented on agarose gel and stained with Gel-Red dye. The data comprise three individual replicates and are represented as mean ± SD; “ns” indicates not significant. (J) Restriction enzyme accessibility assay and its quantification diagram of cBAF complexes containing ARID1A WT or ΔIDR1b. The DNA product in REAA is presented on agarose gel and stained with Gel-Red dye. The data comprise three individual replicates and are represented as mean ± SD; “ns” indicates not significant. (K) Schematic of the mechanism by which ARID1A IDR targets EWS-FLI1 condensates and finetunes chromatin remodeling.

