
FIGURE 3.
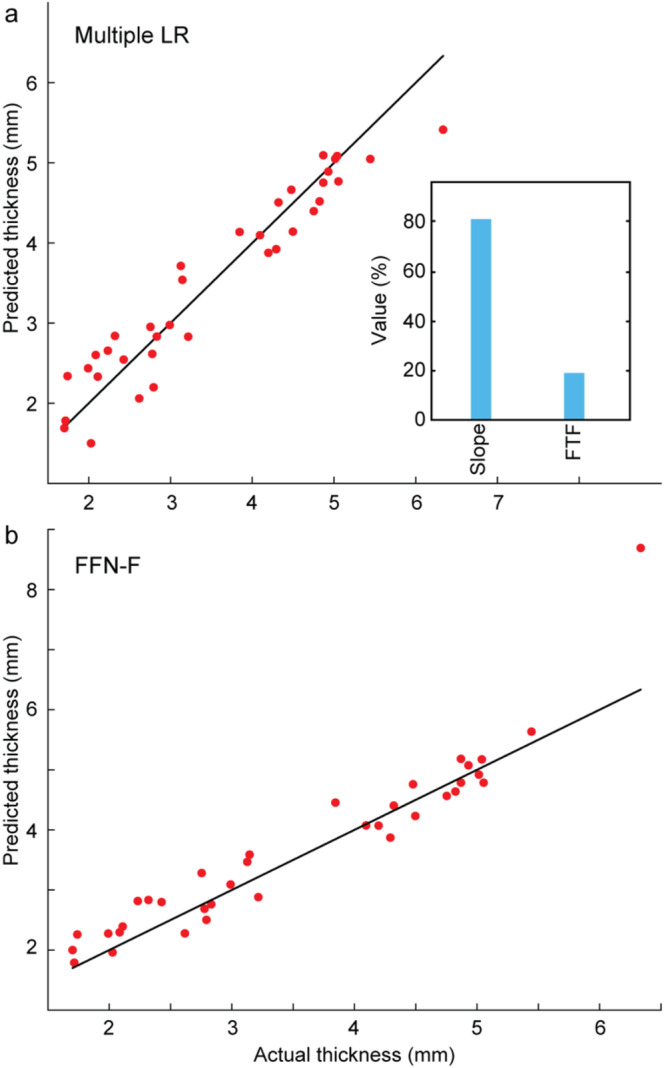
Evaluation of the performance of thickness prediction on the test data. (a) best ML architecture (MLR: multiple LR) and (b) best DL architecture (FFN‐F). Percent contributions of the most significant features are shown for the ML architecture. Multiple LR: multiple linear regression; FFN‐F: feed‐forward network (features as input).