
FIGURE 4.
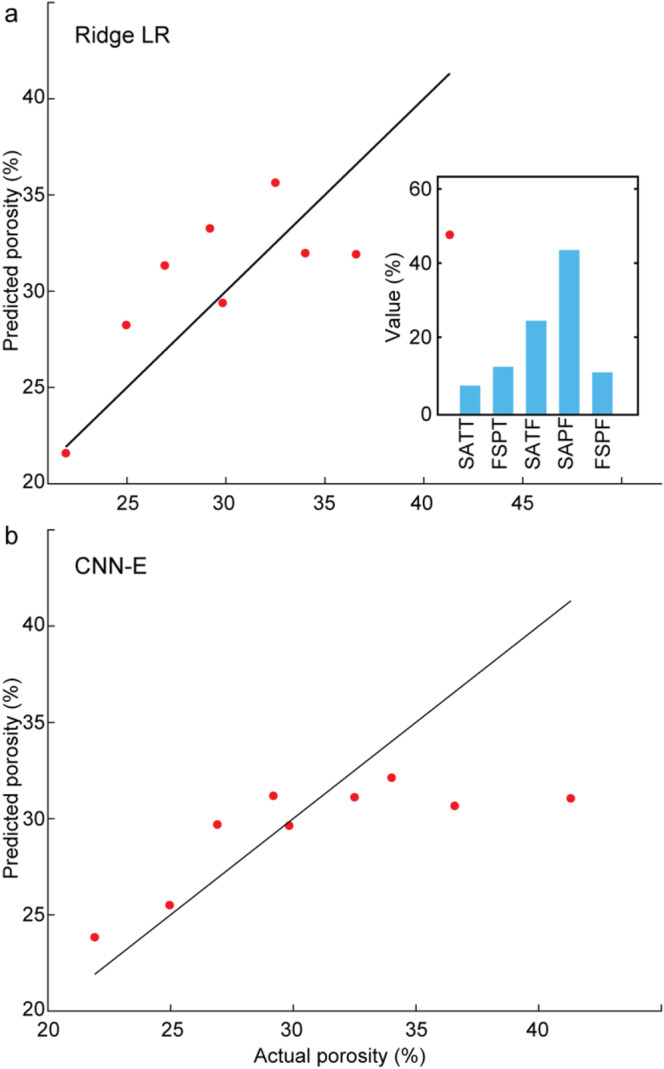
Evaluation of the performance of porosity prediction on the test data. (a) best ML architecture (RLR: Ridge LR), and (b) best DL architecture (CNN‐E). Percent contributions of the most significant features are shown for the ML architecture. Ridge LR: ridge linear regression. CNN‐E: convolutional neural network (envelope as input). SATT: SA‐Total‐T, FSPT: FWHM‐SP‐T, SATF: SA‐Total‐F, SAPF: SA‐SP‐F, FSPF: FWHM‐SP‐F.