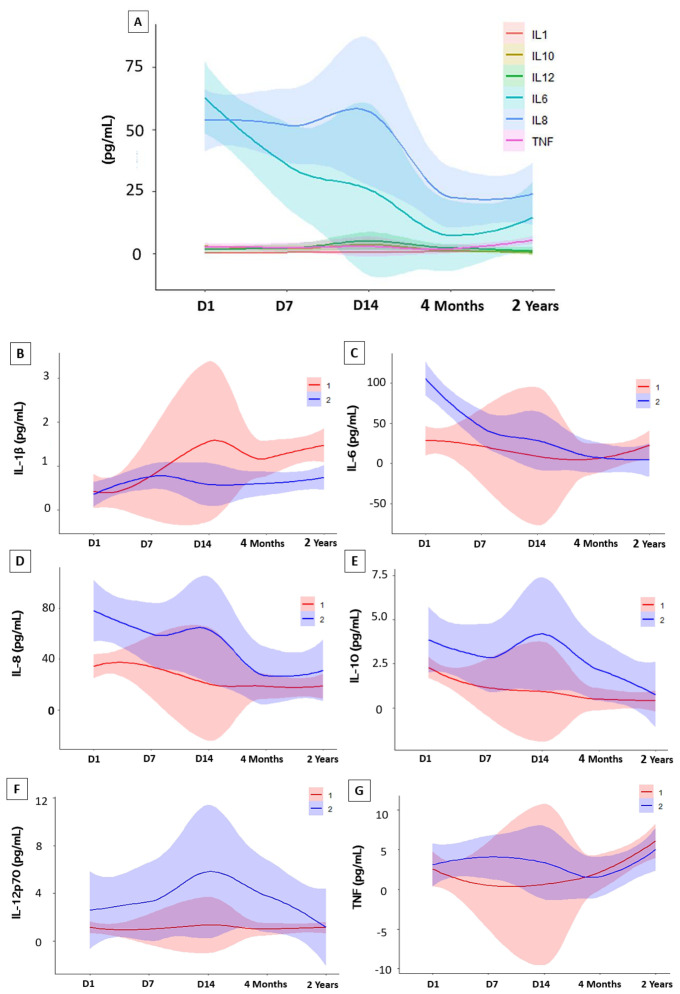
Figure 4.
Variations in cytokine levels during follow-up. Statistical analysis were performed using interactions in a linear mixed-effects model. (A) Cytokine Trend Model of study participants in the Acute Phase (Day 1, Day 7 and Day 14) and Convalescent Phase (4 months and 2 years). Analysis of interactions between sex. (B) (IL-1β) interleukin 1-beta; (C) (IL-6) interleukin 6; (D) (IL-8) interleukin 8 (E) (IL-10) interleukin 10; (F) (IL-12p70) interleukin 12p70 and (G) (TNF) Tumor Necrosis Factor. Abbreviations: (1) Women; (2) Men.

