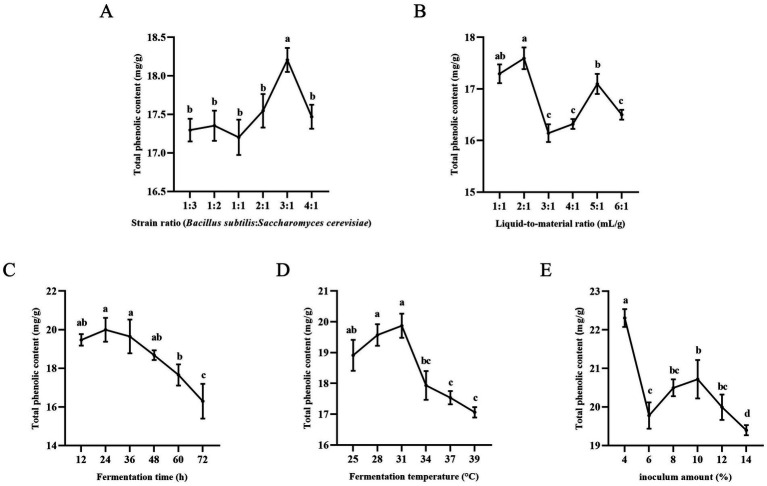
Figure 1.
Results of single-factor experiments. (A) Effect of strain ratio on total phenol content. (B) Effect of liquid-to-material ratio on total phenol content. (C) Effect of fermentation time on total phenol content. (D) Effect of fermentation temperature on total phenol content. (E) Effect of inoculation amount on total phenol content. Columns marked with different lowercase letters indicate significant differences among treatments by using Duncan analysis (p < 0.05).

