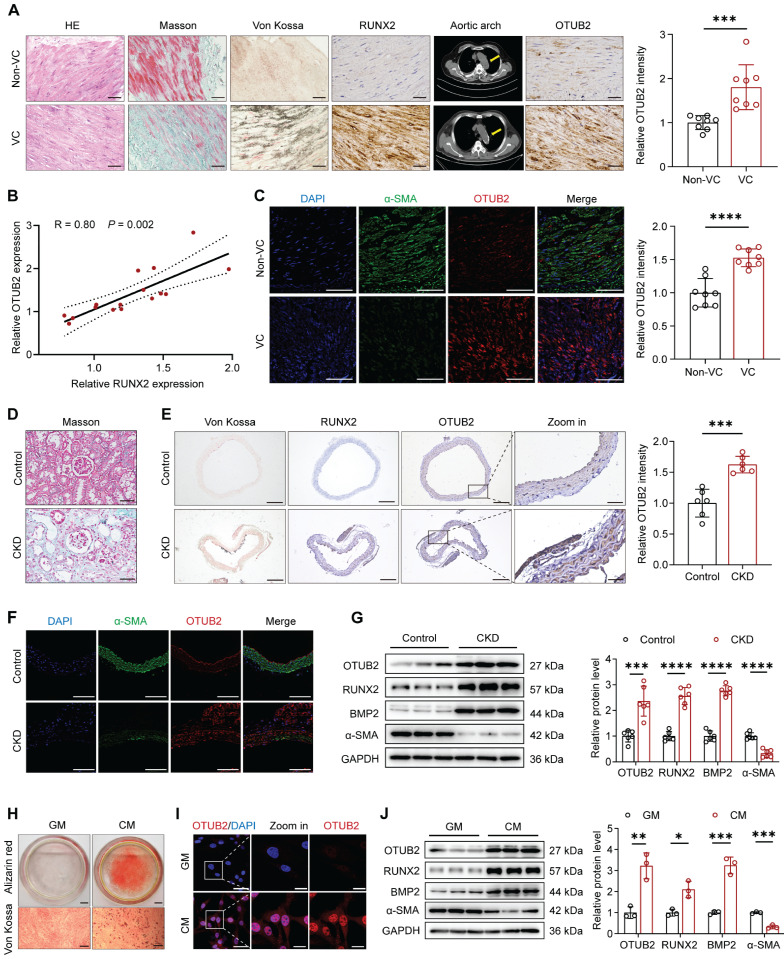
Figure 1.
OTUB2 expression is upregulated during VC. (A) Representative images of HE staining, Masson's trichrome staining, Von Kossa staining, and immunohistochemical staining for RUNX2 and OTUB2 expression in radial arteries and multidetector computed tomography (MDCT) scans of CKD patients without or with calcification. Scale bars, 50 μm. n = 8 per group. (B) Scatter dot plot of the correlation between OTUB2 and RUNX2 expression in radial arteries from CKD patients without or with calcification. n = 16. (C) Representative images of immunofluorescence staining for OTUB2 and α-SMA in radial arteries from CKD patients without or with calcification. Scale bars, 100 μm. n = 8 per group. (D) Representative images of Masson's trichrome staining of kidneys from the control and CKD groups. Scale bars, 50 μm. (E) Representative images of Von Kossa staining and immunohistochemical staining for RUNX2 and OTUB2 in the arteries of mice from the control and CKD groups. Scale bars, 200 μm (left panels), 50 μm (right panels). n = 6 per group. (F) Representative images of immunofluorescence staining for OTUB2 and α-SMA in the arteries of the indicated groups. Scale bars, 100 μm. (G) Western blot analysis and quantification of OTUB2, RUNX2, BMP2, and α-SMA expression. n = 6 per group. (H) Representative images of Alizarin red and Von Kossa staining. Scale bars, 5 mm (upper panels), 100 μm (lower panels). (I) Representative images of immunofluorescence staining for OTUB2 expression in VSMCs treated with GM or CM. Scale bars, 50 μm (left panels), 20 μm (right panels). (J) Immunoblots and quantification of OTUB2, RUNX2, BMP2, and α-SMA protein expression in VSMCs treated with GM or CM. n = 3 per group. Statistical significance was assessed using two-tailed t-test (A, C, E, G, J). All values are presented as mean ± SD. *P < 0.05, **P < 0.01, ***P < 0.001, and ****P < 0.0001.

