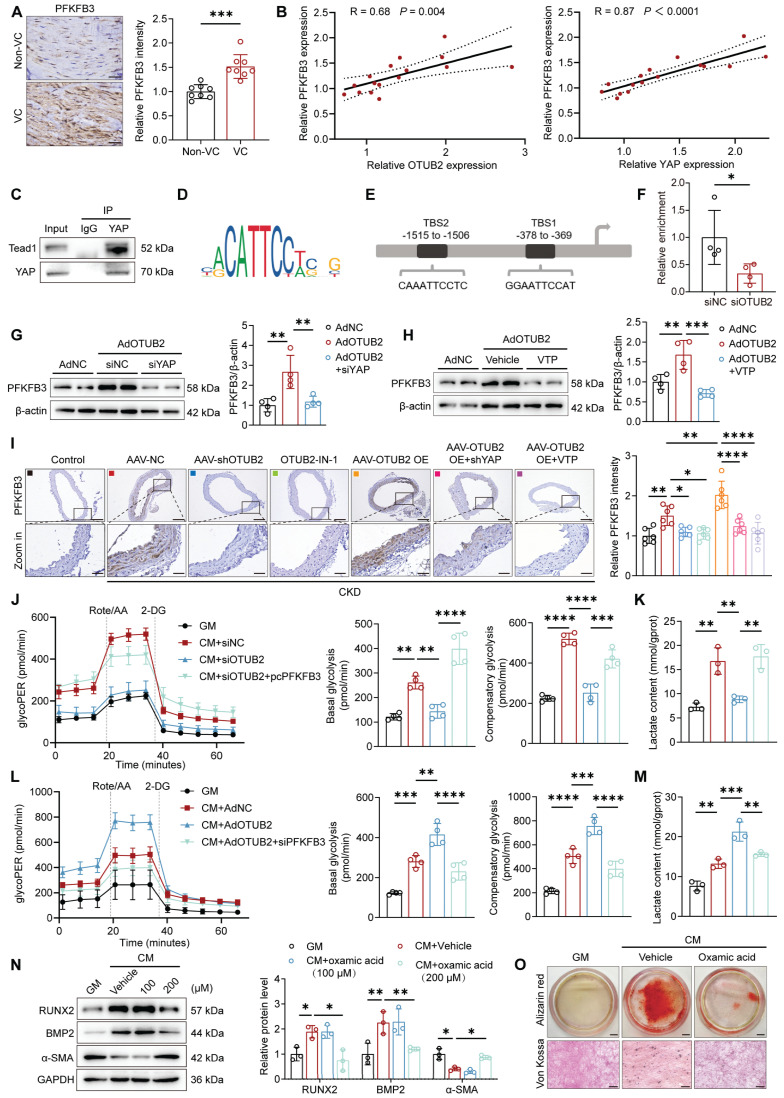
Figure 6.
OTUB2 facilitates PFKFB3 transcription through YAP. (A) Representative immunohistochemical staining for PFKFB3 of radial arteries from CKD patients. Scale bars, 50 μm. n = 8 per group. (B) Scatter dot plot of the correlation between PFKFB3, OTUB2 and YAP expression in radial arteries from CKD patients. n = 16. (C) Co-IP assays were performed to verify the interaction between YAP and TEAD1 in VSMCs. (D) Binding motif of TEAD1. (E) Predicted binding sites of TEAD1 in the promoter of PFKFB3. (F) CUT&RUN-qPCR assays were performed to confirm the relative enrichment of genes in VSMCs with the IgG and YAP antibodies. n = 4 per group. (G-H) Western blot analysis and quantification of PFKFB3 protein expression in VSMCs after the indicated treatments. n = 4 per group. (I) Immunohistochemical staining for PFKFB3 in aortic sections from the indicated groups. Scale bars, 200 μm (upper panels), 50 μm (lower panels). n = 6 per group. (J) Glycolysis rate assays were conducted using VSMCs subjected to different treatments with a Seahorse analyzer. n = 4 per group. (K) The lactate content was detected after different treatments. n = 3 per group. (L) Glycolysis rate assays were conducted using VSMCs subjected to different treatments with a Seahorse analyzer. n = 4 per group. (M) The lactate content was detected after different treatments. n = 3 per group. (N) Western blot analysis and quantification of RUNX2, BMP2, and α-SMA protein expression in VSMCs after oxamic acid treatment. n = 3 per group. (O) Representative images of Alizarin red and Von Kossa staining of VSMCs after the indicated treatments and CM exposure for another 7 days. Scale bars, 5 mm (upper panels), 100 μm (lower panels). Statistical significance was assessed using t-test (A, F) and one-way ANOVA followed by Dunnett's test (G, H, I, J, K, L, M, N). All values are presented as mean ± SD. *P < 0.05, **P < 0.01, ***P < 0.001, and ****P < 0.0001.

