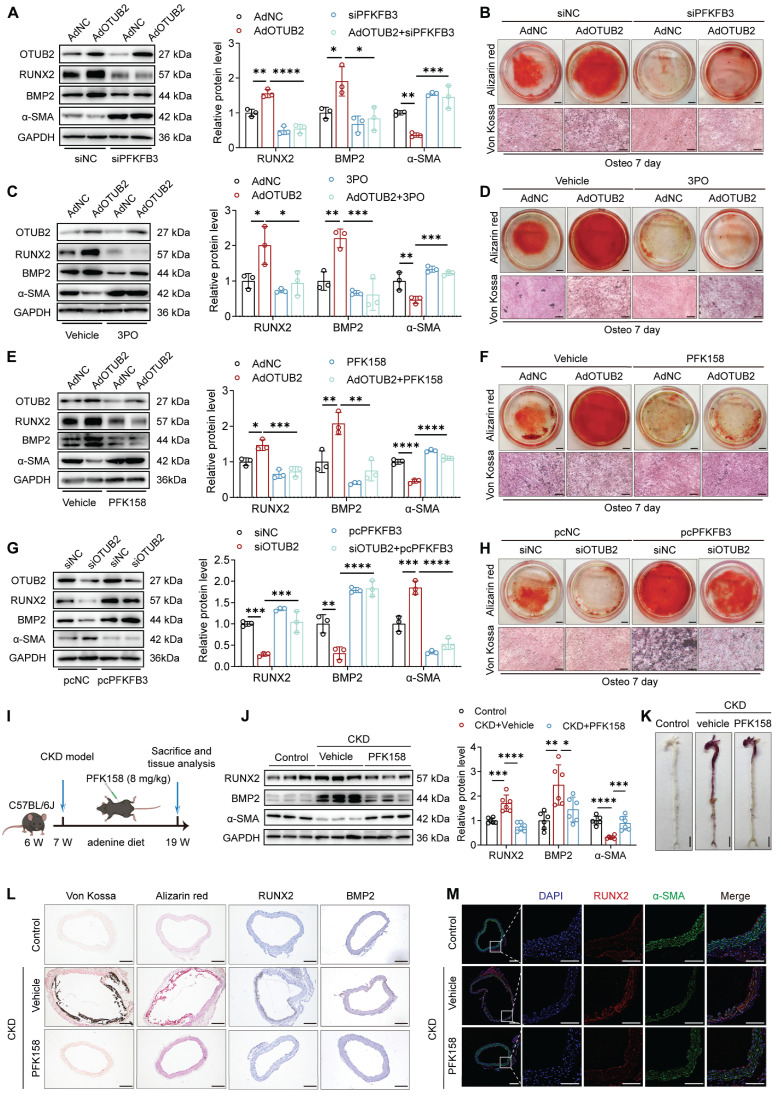
Figure 7.
OTUB2 exerts procalcific effects through PFKFB3 upregulation. (A) Western blot analysis and quantification of RUNX2, BMP2, and α-SMA protein expression. n = 3 per group. (B) Representative images of Alizarin red and Von Kossa staining images. Scale bars, 5 mm (upper panels), 100 μm (lower panels). (C) Western blot analysis and quantification of RUNX2, BMP2, and α-SMA protein expression. n = 3 per group. (D) Representative images of Alizarin red and Von Kossa staining images. Scale bars, 5 mm (upper panels), 100 μm (lower panels). (E) Western blot analysis and quantification of RUNX2, BMP2, and α-SMA protein expression. n = 3 per group. (F) Representative images of Alizarin red and Von Kossa staining images. Scale bars, 5 mm (upper panels), 100 μm (lower panels). (G) Western blot analysis and quantification of RUNX2, BMP2, and α-SMA protein expression. n = 3 per group. (H) Representative images of Alizarin red and Von Kossa staining images. Scale bars, 5 mm (upper panels), 100 μm (lower panels). (I) Experimental protocols used in (J) through (M). (J) Western blot analysis and quantification of RUNX2, BMP2 and α-SMA expression in aortas. n = 6 per group. (K) Representative images of Alizarin red staining of whole aortas. Scale bars, 5 mm. (L) Representative images of Von Kossa staining, Alizarin red staining, and immunohistochemical staining for RUNX2 and BMP2 in aortas from the indicated experimental cohorts. Scale bars, 200 μm. (M) Representative images of immunofluorescence staining for RUNX2 and α-SMA in aortas. Scale bars, 200 μm (left panels), 100 μm (right panels). Statistical significance was assessed using one-way ANOVA followed by Dunnett's test (A, C, E, G, J). All values are presented as mean ± SD. *P < 0.05, **P < 0.01, ***P < 0.001, and ****P < 0.0001.

