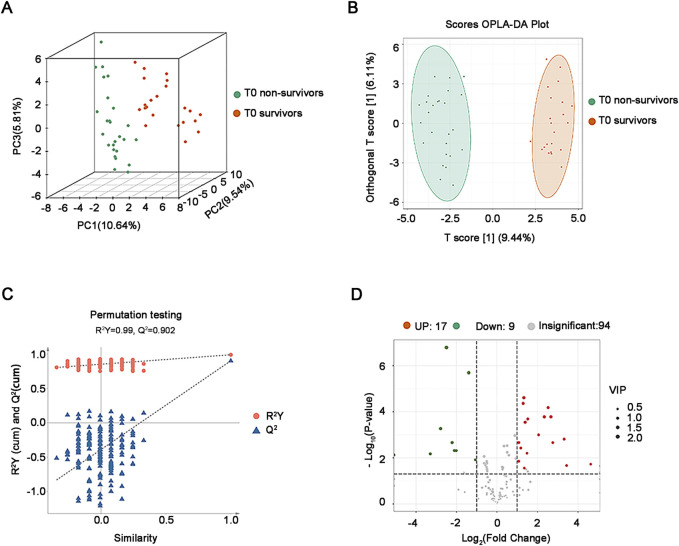
FIGURE 2.
Analysis of plasma oxidative lipidomics in critical SA-AKI patients at T0. (A) 3D PCA of survivors and non-survivors at T0. (B) OPLS-DA Score plot of survivors and non-survivors at T0. (C) Permutation testing of the OPLS-DA model in critical SA-AKI patients at T0. Q2 represents predictive and R2Y represents interpretability of the OPLS-DA model. Q2 = 0.902, R2Y = 0.99. (D) Volcano plots of all oxidized lipids in non-survivors and survivors at T0. Abbreviations: PCA, principal component analysis; OPLS-DA, orthogonal projections to latent structures discriminant analysis.

