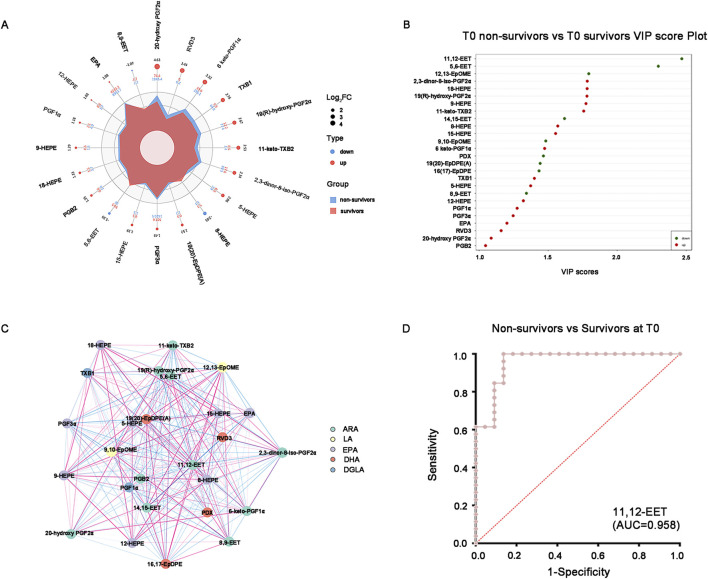
FIGURE 3.
Promising oxidized lipids for distinguishing survivors and non-survivors at T0. (A) Combined radar chart of the different oxidized lipids between survivors and non-survivors at T0. The outermost layer represents the name of the substance. The second layer displays the log2FC value of the substance between the two groups. The third layer represents the absolute value of the log2FC of substances in the two groups using point size. The fourth layer indicates the quantitative mean of substances in the two groups. The fifth layer shows the differences in the mean values of substances between the two groups after log2 processing, based on their area size. (B) VIP score plot of the different oxidized lipids between survivors and non-survivors at T0. The top 20 differential oxidative lipids with the highest VIP Score were displayed. (C) The correlation network diagram of the different oxidized lipids between survivors and non-survivors at T0. The red line indicates a positive correlation, whereas the blue line indicates a negative correlation. The thickness of the line corresponds to the absolute value of the correlation coefficient, with thicker lines indicating stronger correlations. (D) ROC curve of the 11,12-EET distinguishes the non-survivors from survivors at T0. AUC = 0.958. Abbreviations: VIP, variable importance in projection; ROC, receiver operating characteristic; AUC, area under the curve.

