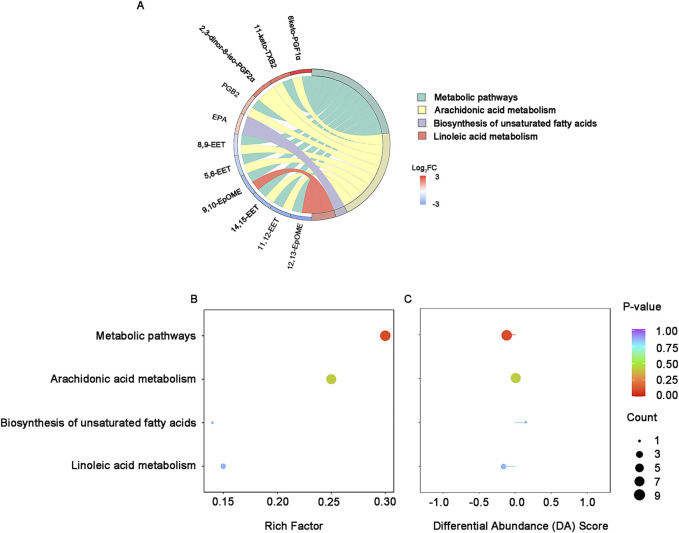
FIGURE 4.
KEGG enrichment and integral analysis of differential oxidized lipids between survivors and non-survivors at T0. (A) KEGG enrichment chord diagram at T0. (B) KEGG enrichment bubble plots of the differential oxidized lipids in survivors and non-survivors at T0. The color of bubbles represents the value of adjusted p-value and the significance of this pathway. The size of bubbles represents the number of annotated differential oxidative lipids. (C) DA Score. The horizontal coordinate reflects the expression trend of all identified metabolites in target pathways, and the ordinate indicates the difference path name. Abbreviations: KEGG, Kyoto Encyclopedia of Genes and Genomes; DA score: differential abundance score.

