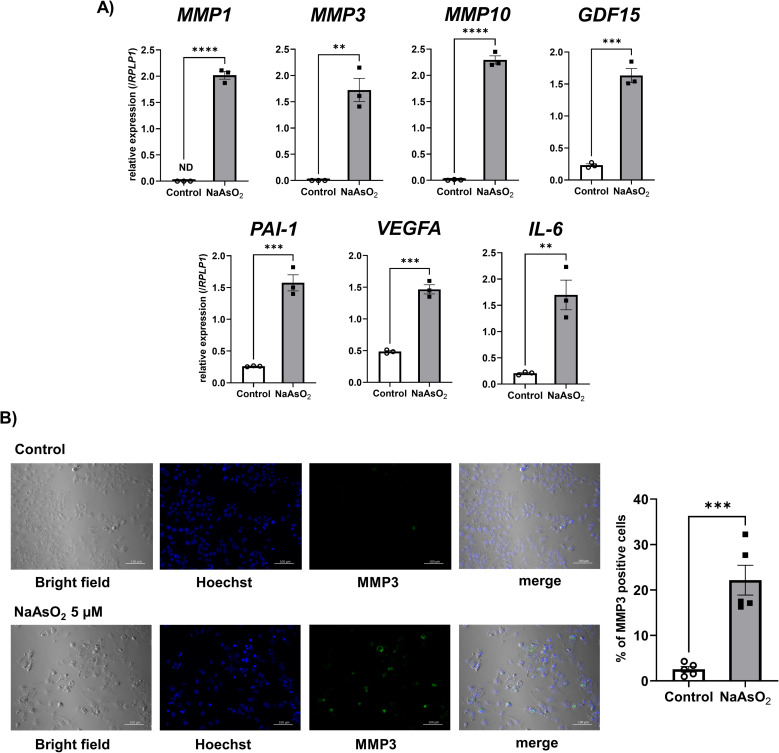
Fig. 4.
Arsenite exposure in Huh-7 cells upregulated genes encoding SASP factors
A) Changes in the gene expressions of SASP factors in the Huh-7 cells after arsenite exposure. The mRNA expression level of each gene was quantified by real-time PCR and normalized to the expression level of RPLP1. The bar graph shows the relative gene expression level of each SASP factor after 72 h of arsenite exposure. Data are presented as the means ± SEM (n = 3). The two-tailed unpaired Student’s t-test was used for statistical analysis. **, ***, ****significantly different from the control; **P < 0.01, ***P < 0.001, ****P < 0.0001. B) Representative bright field images and immunofluorescence staining images of MMP3 and Hoechst 33342 in Huh-7 cells with or without 75 hours of sodium arsenite exposure (left panel). Quantitative result using data from 5 randomly selected fields of view (right panel). The two-tailed unpaired Student’s t-test was used for statistical analysis. ***significantly different from the control; ***P < 0.001.

