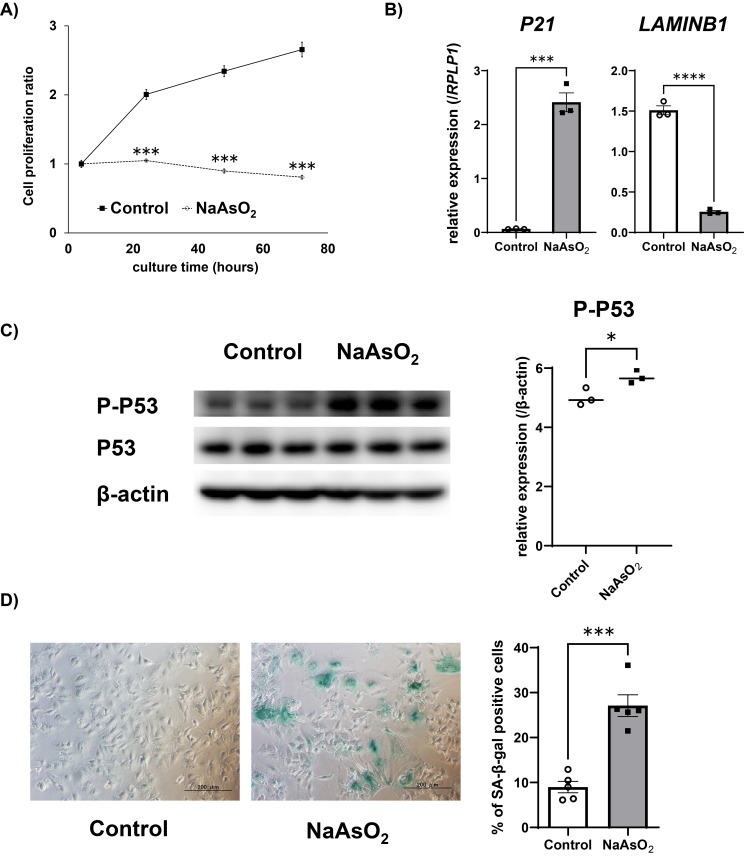
Fig. 5.
Arsenite-induced premature senescence features persisted after exposure cessation in Huh-7 cells
A) Time dependent changes of cell proliferation ratio (the value after 4 hours of incubation was set to 1) after cessation of arsenite exposure. The relative cell viability was assayed using Real-time Glo® in Huh-7 cells. Data are presented as the means ± SEM (n = 3). RLU: relative luminescence units. The two-tailed unpaired Student’s t-test was used for statistical analysis. ***significantly different from the control; ***P < 0.001. B) Changes in the gene expressions of senescence markers in the Huh-7 cells after arsenite exposure. The mRNA level of each gene was quantified by real-time PCR and normalized to the expression level of RPLP1. The bar graph shows the relative gene expression levels of each senescence marker after 72 hours of arsenite exposure followed by 100 hours of culture in the medium without arsenite. Data are presented as the means ± SEM (n = 3). The two-tailed unpaired Student’s t-test was used for statistical analysis. ***, ****significantly different from the control. ***P < 0.001, ****P < 0.0001. C) The protein levels of P-P53 (Ser 15), P53 and β-actin detected by Western blotting after 72 hours of arsenite exposure followed by 100 hours of culture in the medium without arsenite (left panel). The protein expression level was normalized to that of β-actin (right panel). Data are presented as the means ± SEM (n = 3). The two-tailed unpaired Student’s t-test was used for statistical analysis. *significantly different from the control. *P < 0.05. D) SA-β-gal staining of Huh-7 cells after 72 hours of arsenite exposure followed by 7 days of culture in the medium without arsenite (left panel). % of SA-β-gal positive cells were calculated from five representative views (right panel). The two-tailed unpaired Student’s t-test was used for statistical analysis. ***significantly different from the control; ***P < 0.001.

