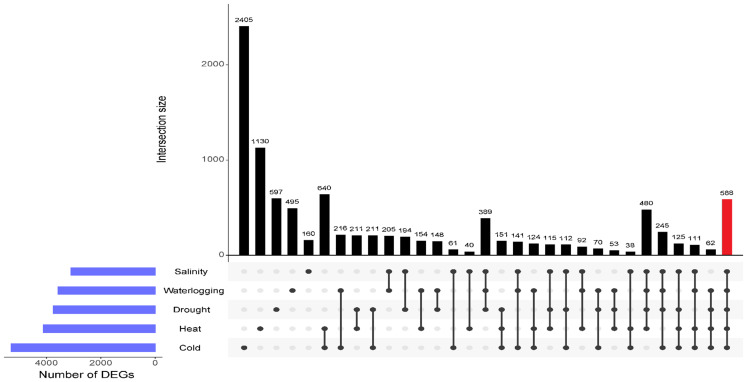
Figure 4.
UpSet plot shows the intersection of DEGs across different comparisons of abiotic stress-treated samples. The horizontal blue bars on the left represent the total number of DEGs for each abiotic stress. The vertical bars represent the size of the intersections between gene sets of different comparisons as shown by the individual dots and connecting lines. DEGs common to five abiotic stresses are highlighted in red bar.

