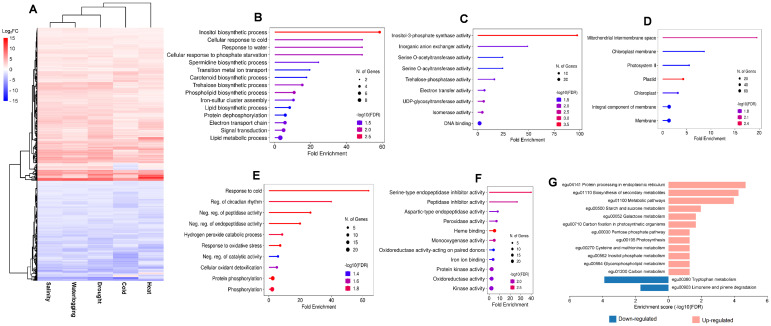
Figure 5.
Expression profiles of core DEGs of five abiotic stresses and the enrichment analysis. (A) Hierarchical clustering analysis of expression patterns for all core DEGs for salinity, waterlogging, drought, and cold and heat stress that segregated DEGs into upregulated and downregulated cluster. Gene ontology enrichment analysis for upregulated core DEGs in the (B) biological process (BP) category, (C) molecular function (MF) category, and (D) cellular component (CC) category. Gene ontology enrichment analysis for downregulated core DEGs in the (E) biological process (BP) category and (F) molecular function (MF) category. (G) KEGG pathway enrichment analysis of core DEGs in upregulated (pink bar) and downregulated (blue bar) cluster.

