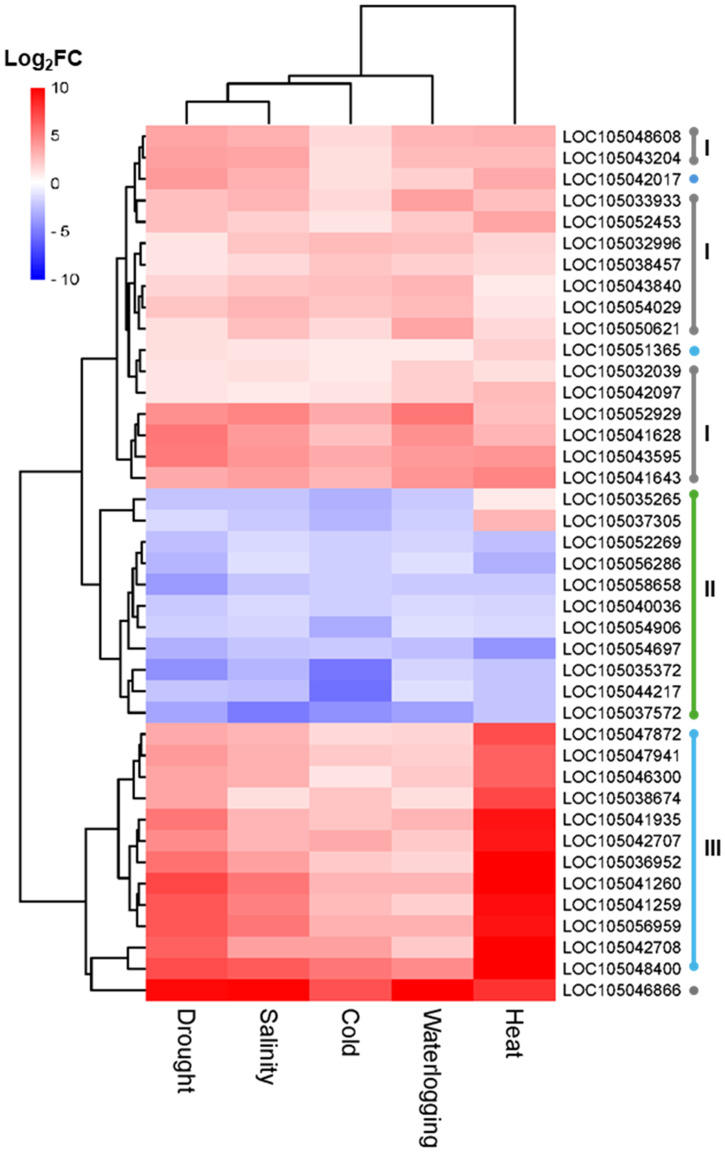
Figure 6.
Hierarchical clustering analysis of expression patterns of core DEGs identified in drought, salinity, cold, waterlogging, and heat samples that significantly enriched in the biosynthesis of secondary metabolites (egu01110, gray dot, I), heme binding (GO:0020037, green dot, II), and protein processing in endoplasmic reticulum (egu04141, blue dot, III).

