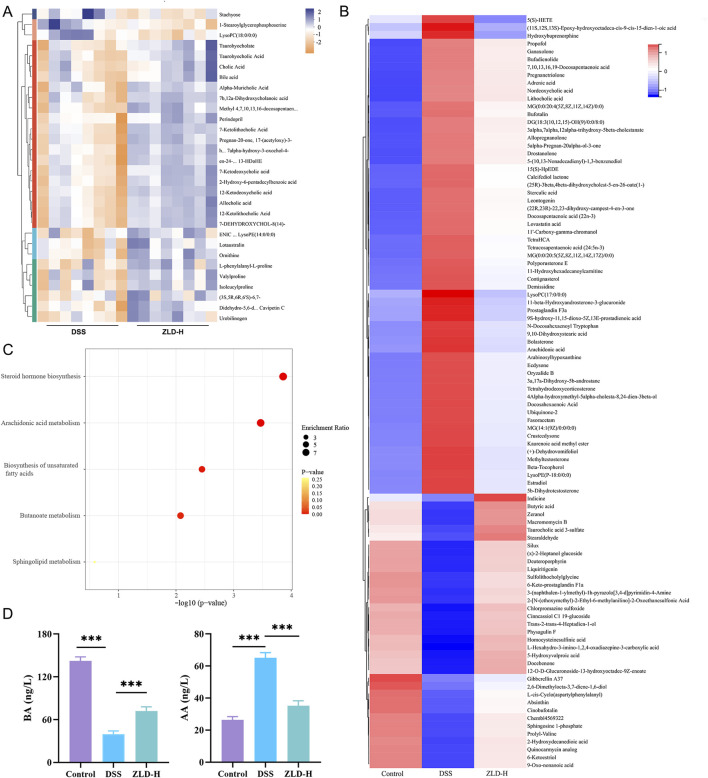
FIGURE 7.
Fecal metabolite composition (n = 8 per group). (A) Heatmap displaying the top 30 fecal metabolites differently expressed between the DSS and ZLD-H groups in the positive ion mode. Different colors indicate different metabolite expressions; (B) Heatmap analysis depicting the relative levels of 96 potential biomarkers through cluster analysis; (C) Metabolic pathway analysis; (D) Expression of butyrate acid and arachidonic acid.

