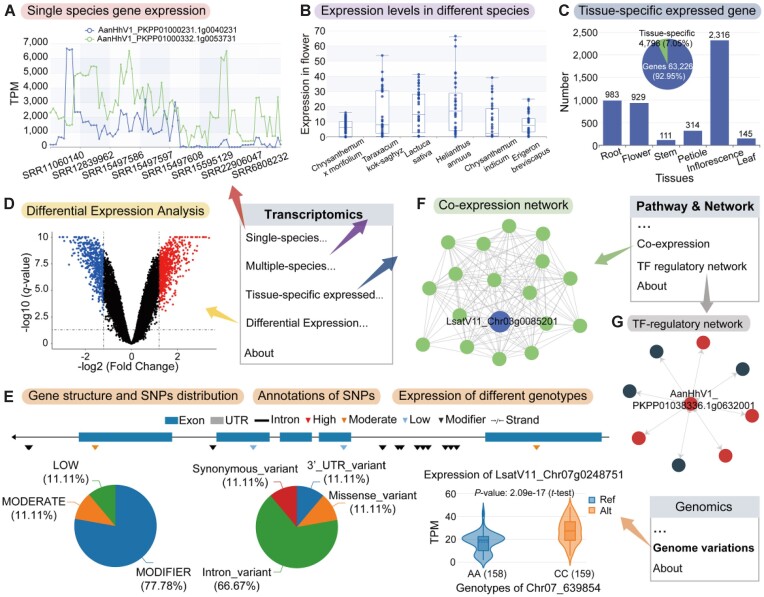
Figure 3.
Functionality and utilization of the ‘Transcriptomic’, ‘Genome variation’ and ‘Pathway & Network’ sections in AMIR. (A) Single-species expression module providing gene or gene set expression profiles for a specific species. (B) Multi-species expression profile page displaying comparisons of expression levels in the same tissue across different species. (C) Tissue-specific expression page allowing users to query and retrieve information on genes specifically expressed in tissues across multiple species. (D) Differential expression analysis page offering data on DEGs under various conditions, with links to the GO/KEGG enrichment analysis. (E) Genome variations module allows users to search for SNP distributions and functional annotations on genes and facilitates comparisons of expression levels between different genotypes. (F) Co-expression network visualizes queried genes and co-expressed genes. (G) TF regulatory network features the queried TF gene as the central dot, with surrounding dots representing genes regulated by the TF, and directional arrows indicating the regulation.

