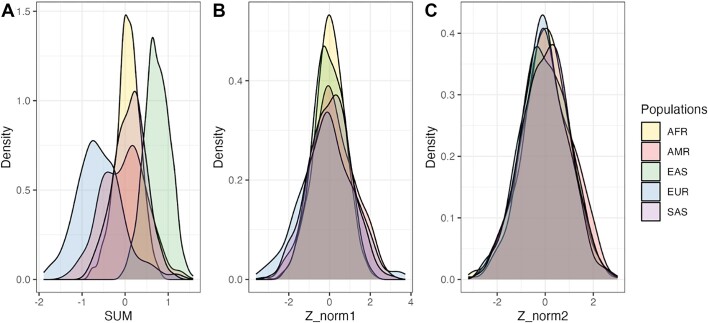
Figure 3.
Density plots of PGSs show PGSs are confounded by genetic ancestry. A PGS is the weighted sum of effect allele dosages multiplied by their effect weight (A, SUM). The PGS Catalog Calculator also includes PCA-based adjustment methods to normalize PGS mean (B, Z_norm1) and mean + variance (C, Z_norm2). Population labels represent similarity to super-population labels in a reference panel (e.g. SAS means similar to the South Asian population descriptor in 1000 Genomes).

