Figure 1.
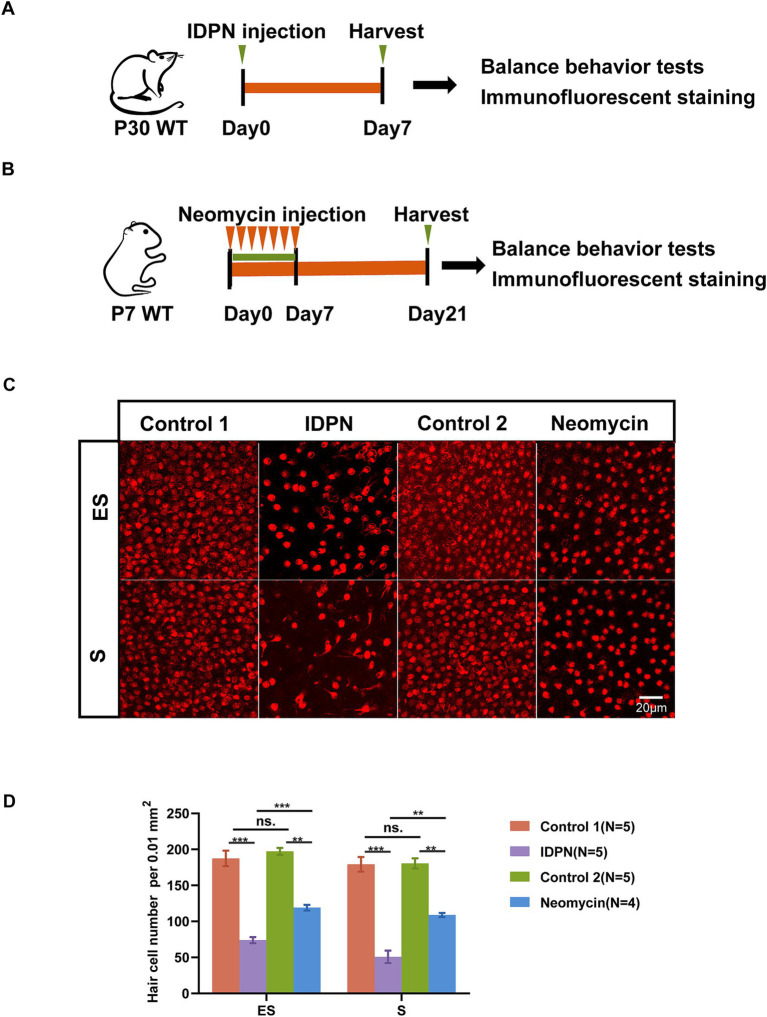
IDPN treatment causes more severe HCs damage than neomycin. (A,B) Schematic diagram of the in vivo IDPN damage model (A) and in vivo neomycin damage model (B). (C,D) Images (C) and statistical analysis of HCs number (D) of Striola (S) and Exstriola (ES) region of the utricle treated by neomycin and IDPN. Myo7a stained in red is used as HCs marker. Scale bar is 20 μm in (C) *p < 0.05, **p < 0.01, ***p < 0.001, ns, no significant difference. The number of mice (N) is shown in parentheses.

