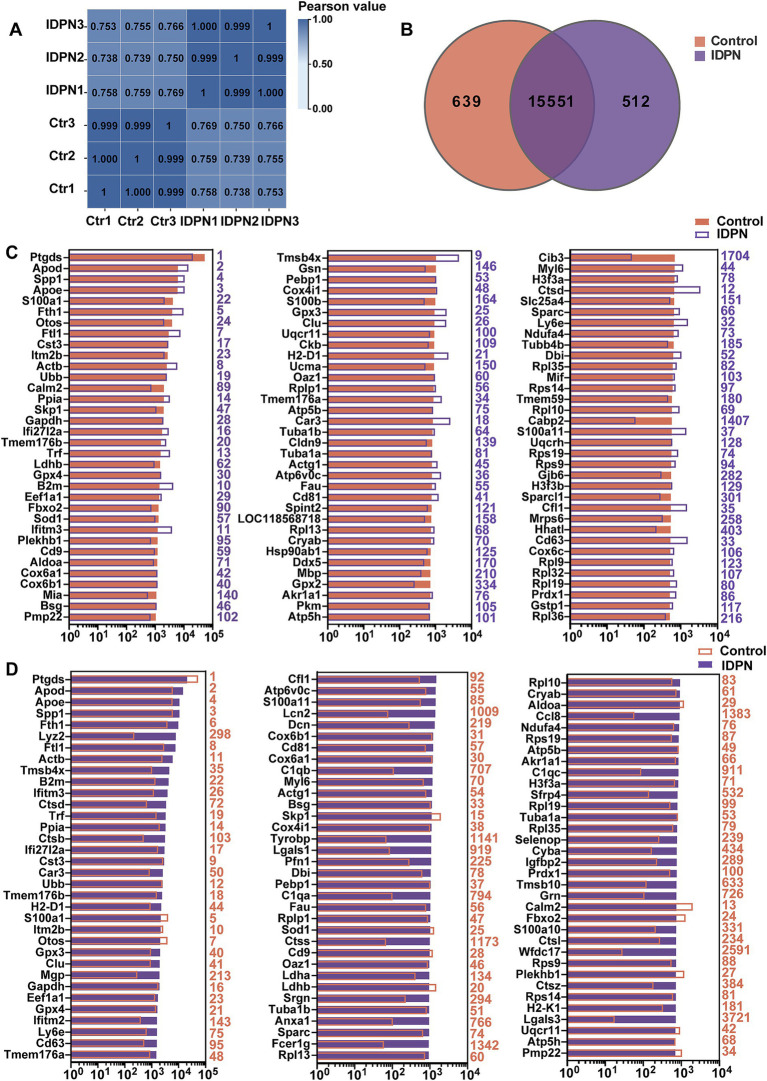
Figure 3.
Analysis of RNA-seq data of IDPN treated and untreated utricle. (A) Correlation analysis of all replicated data of Control and IDPN groups. (B) Venn diagram showing the number of genes expressed in IDPN and Control. (C) The top 100 genes with high expression level in Control group in descending order. The purple number on the right side of each panel represents the same gene ranking in the IDPN group. (D) The top 100 genes highly expressed in IDPN group in descending order. The red numbers on the right side of each panel represent the same gene ranking in Control group.

