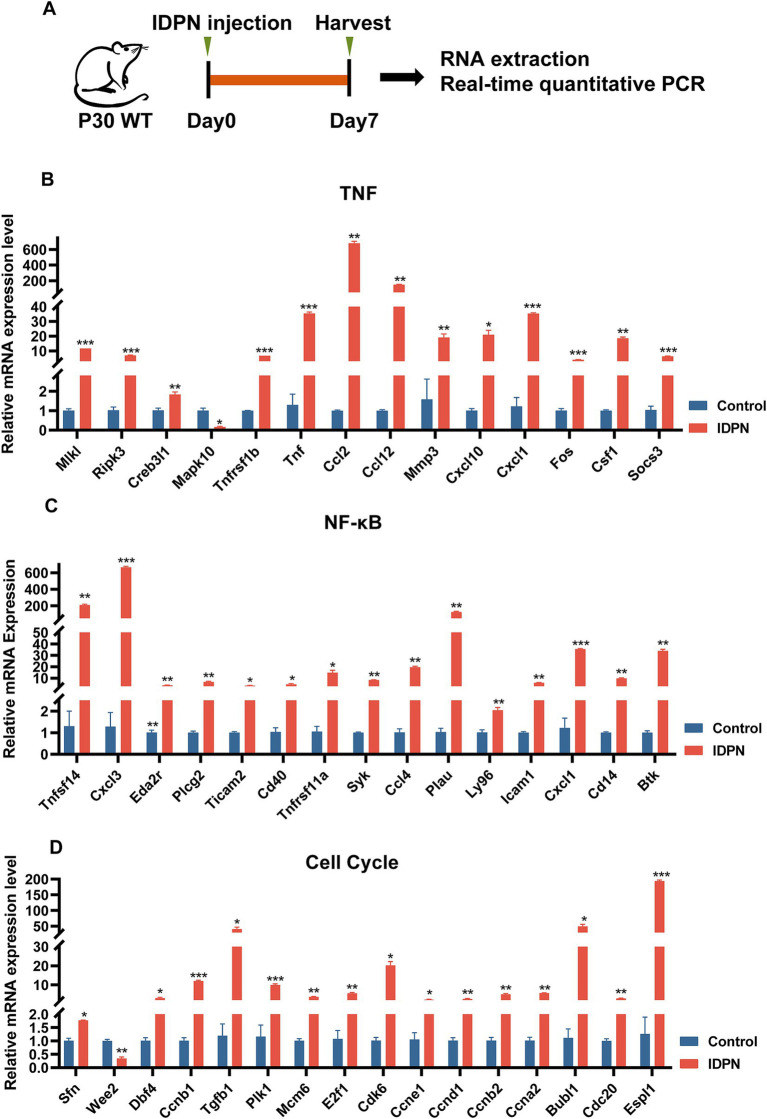
Figure 6.
Quantification of the expression of signaling pathway genes. (A) The flow diagram for IDPN injection and utricle collection at P7 for Real-time QPCR. (B–D) Verification of expression level of DEGs in TNF signal pathway (B), NF-κB signal pathway (C), and cell cycle (D) by Real-time QPCR. *p < 0.05, **p < 0.01, ***p < 0.001. n = 3.

