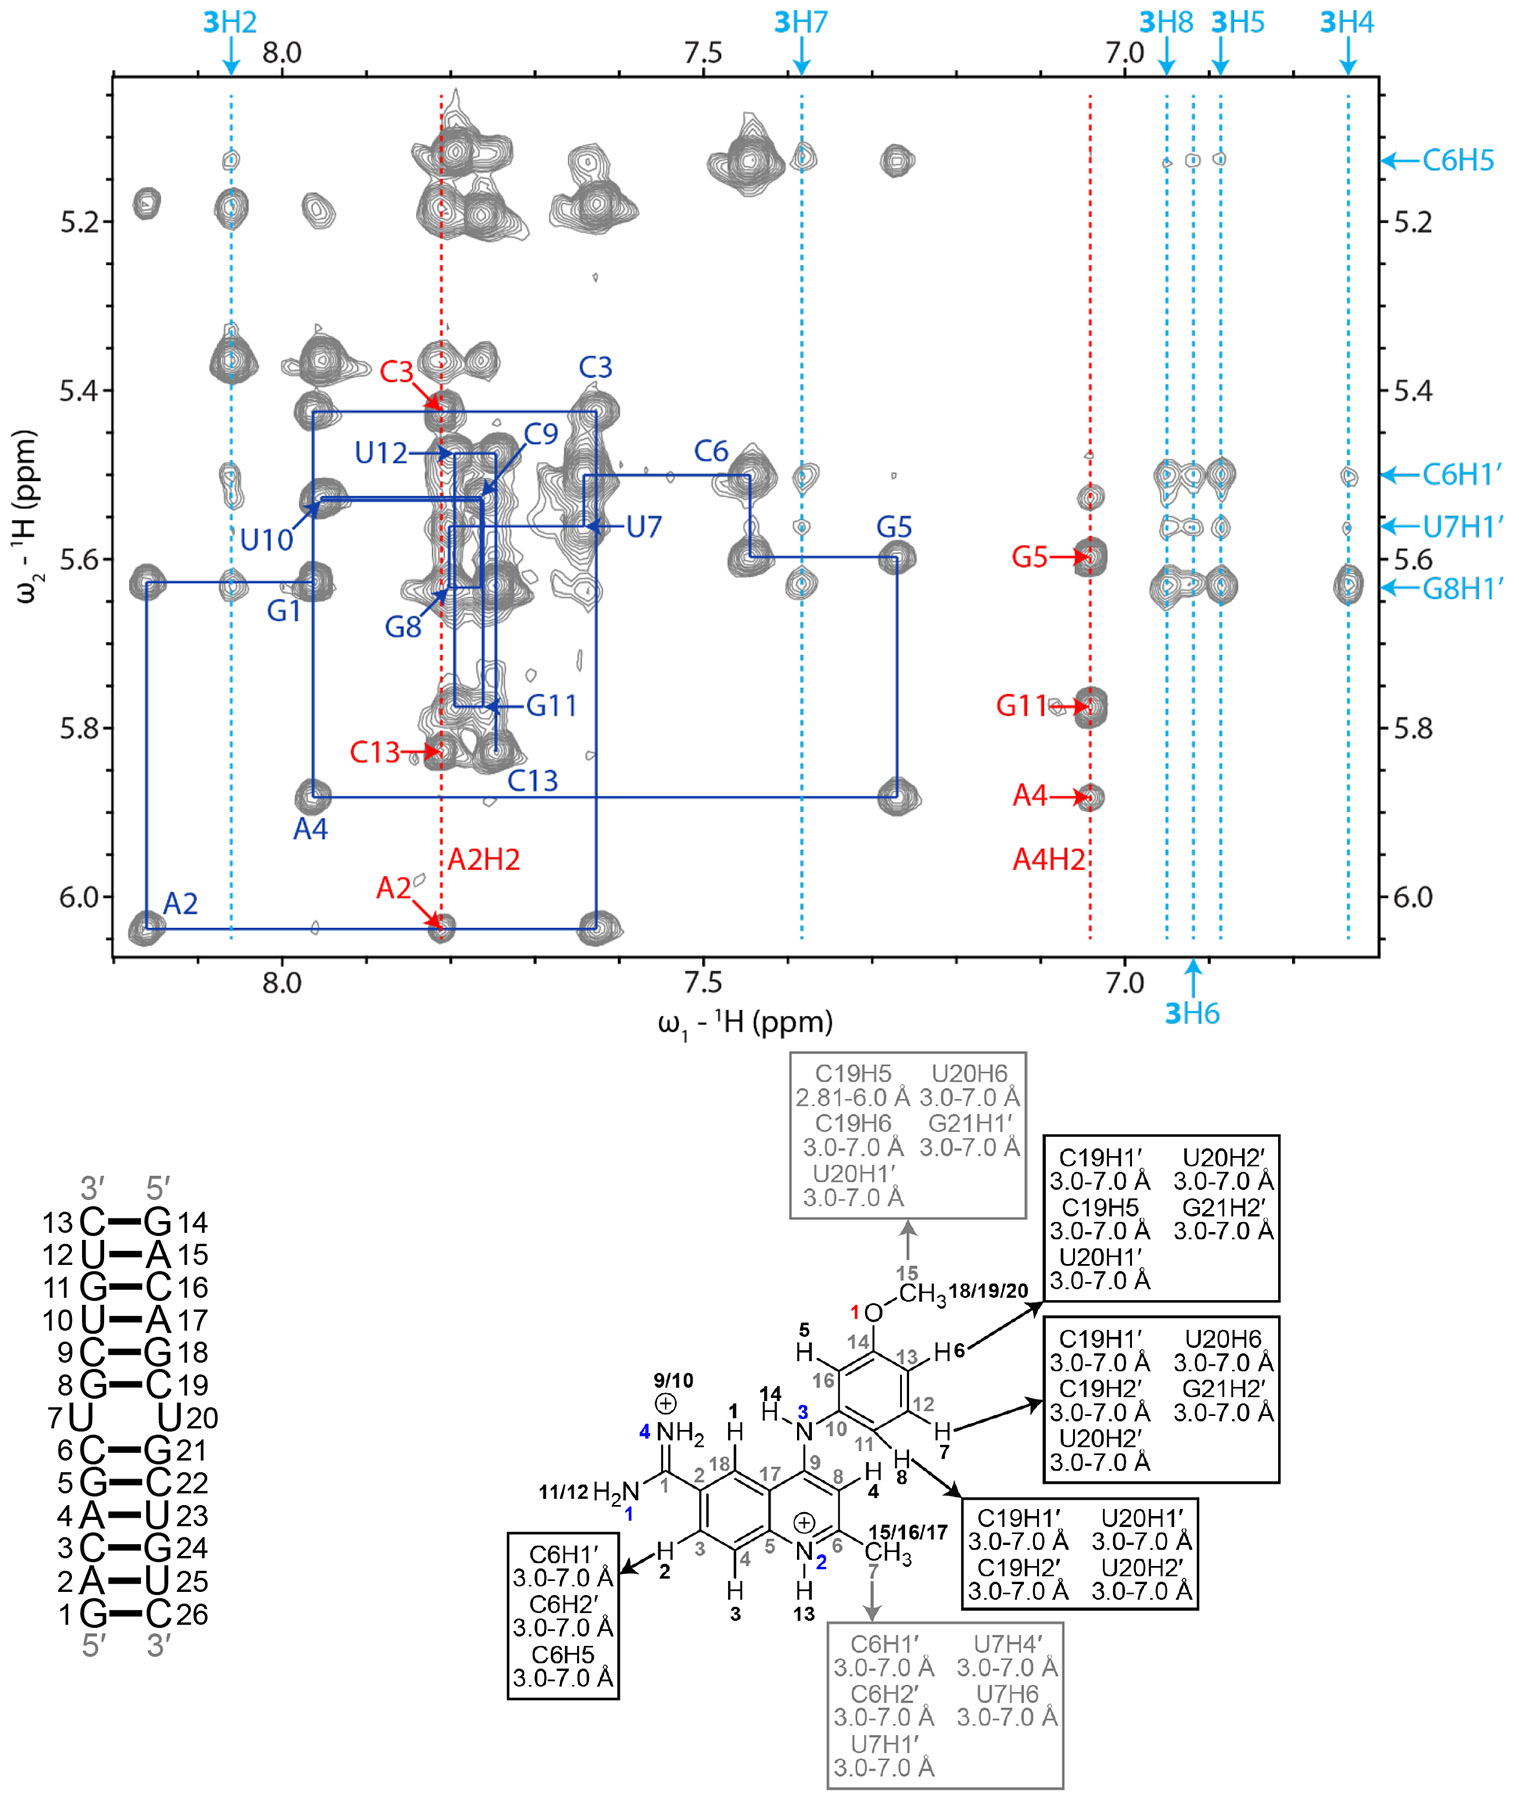
Figure 5: H6/H8-H1′ region of a 2D 1H-1H NOESY spectrum of the r(CUG)-3 complex.

Blue lines represent a sequential H6/H8-H1′ walk, and blue labels represent intraresidue H6/H8 to H1′ NOEs. Dashed red lines represent adenine H2 resonances, and red labels represent interresidue and intraresidue NOEs between adenine H2 and H1′ of nearby residues. Dashed light blue lines represent aromatic proton resonances of 3. Light blue labels around the edges of the spectrum correspond to r(CUG) and aromatic hydrogens of 3 in RNA-3 NOEs. RNA residues are only numbered from 1 to 13 in the NMR spectrum, and residues 14 to 26 correspond to residues 1 to 13 due to the symmetry of the RNA construct. In the chemical structure of 3, black numbers represent hydrogens, gray numbers represent carbons, blue numbers represent nitrogens, and red numbers represent oxygen. NOEs between the RNA and 3 and their corresponding distance restraints used for modeling are colored according to the atoms of 3. The spectrum was acquired at 35 °C with 400 ms mixing time and 0.4 mM of RNA and 0.6 mM of 3.
