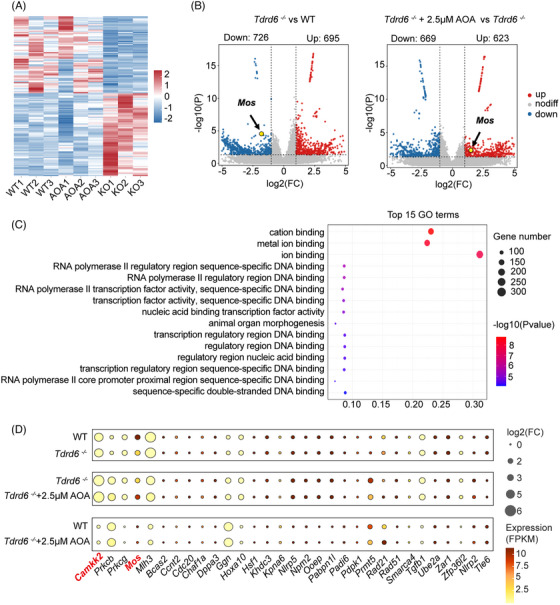
FIGURE 6.

RNA‐seq analysis of the transcriptomes of the zygotes of WT, Tdrd6−/− , and Tdrd6−/− ‐ICSI‐AOA groups. (A) Heatmap analysis of the wild‐type (WT) group, Tdrd6−/− group, and Tdrd6−/− ‐ICSI‐AOA group. Three biological replicates were performed for each group, and for each replicate, six 2‐pronuclear (2PN) zygotes were collected 6 h after intracytoplasmic sperm injection (ICSI). (B) Volcano map analysis of the WT group, Tdrd6−/− group and Tdrd6−/− ‐ICSI‐AOA group, with arrows indicating the Mos gene. (C) Gene Ontology (GO) functional analysis of the genes with significant differences in expression observed between the WT group and Tdrd6−/− group and between the Tdrd6−/− group and Tdrd6−/− ‐ICSI‐AOA group, and no significant differences in expression between the WT group and the Tdrd6−/− ‐ICSI‐AOA group. (D) Bubble map showing the expression of genes related to embryonic development for the WT group, Tdrd6−/− group, and Tdrd6−/− ‐ICSI‐AOA group. The color and size of the dots indicate the expression level (FPKM) and the absolute value of the log2‐transformed fold change, respectively. Camkk2 was noted for its large fold change. Mos was noted for its high expression level and large fold change.
