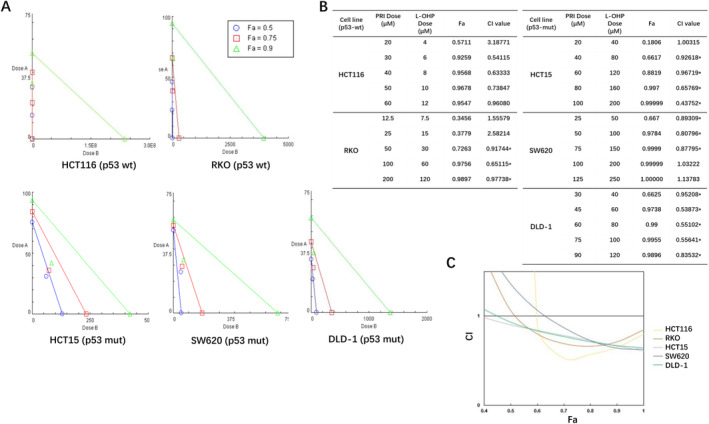
FIGURE 2.

PRIMA‐1met (PRI) and L‐OHP synergistically inhibited cell growth in different CRC cell lines. (A) Isobologram analysis of the combination of PRI and L‐OHP in RKO, HCT, SW620, and DLD‐1. The individual doses of PRI and L‐OHP to achieve 90% (green line) growth inhibition (Fa = 0.90), 75% (red line) growth inhibition (Fa = 0.75), and 50% (blue line) growth inhibition (Fa = 0.50) were plotted on the x‐and y‐axes. CI values calculated using Calcusyn software is represented by points above (indicate antagonism between drugs) or below the lines (indicate synergy). Drug A is PRI and drug B is L‐OHP). (B) The combination index (CI)‐fraction affected (FA) curves for CRC cells exposed to PRI and L‐OHP in a fixed molar ratio based on the IC50. Drug exposure was 48 h. (C) This plot was fit by the program based on the actual values, showing synergism (CI < 1) at high FA values.
