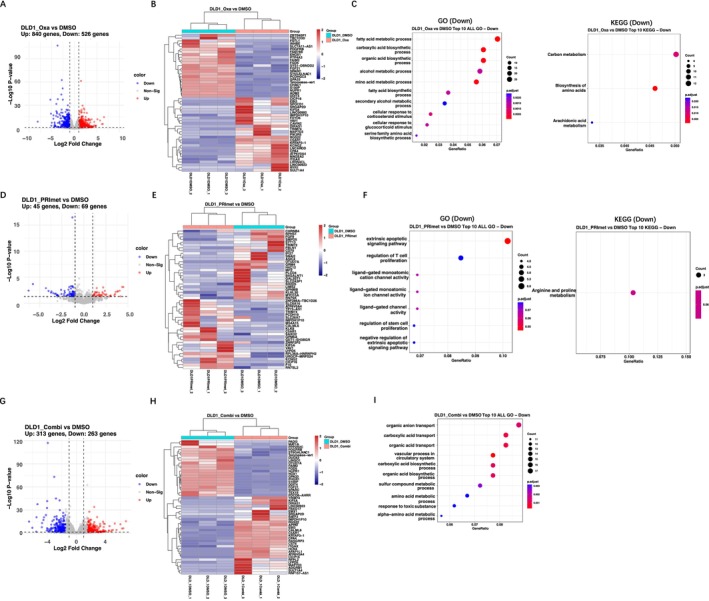
FIGURE 6.

Analysis of DEGs in p53‐mutant DLD‐1 treated with different modalities. (A) Volcano plot of all significantly changed and (B) heatmap of top 50 DEGs ranked by fold change in L‐OHP vs. DMSO. (C) GO and KEGG pathway analysis of DEGs in group of L‐OHP vs. DMSO. (D) Volcano plot of all significantly changed and (E) heatmap of top 50 DEGs ranked by fold change in PRI vs. DMSO. (F) GO and KEGG pathway analysis of DEGs in group of PRI vs. DMSO. (G) Volcano plot of all significantly changed and (H) heatmap of DEGs screening between combination vs. DMSO. (I) GO term analysis of DEGs in group of combination vs. DMSO. Red dots indicate upregulated genes, and blue dots indicate down‐regulated genes. The X‐axis represents the gene ratio and the Y‐axis represents the GO and KEGG terms. The size of the circle indicates the enriched gene count and the color represents the −log10 (p‐value) of each term. PRI: PRIMA‐1met; Oxa: oxaliplatin, L‐OHP; Combi: combination of PRI and Oxa; GO: Gene Ontology; KEGG: Kyoto Encyclopedia of Genes and Genomes.
