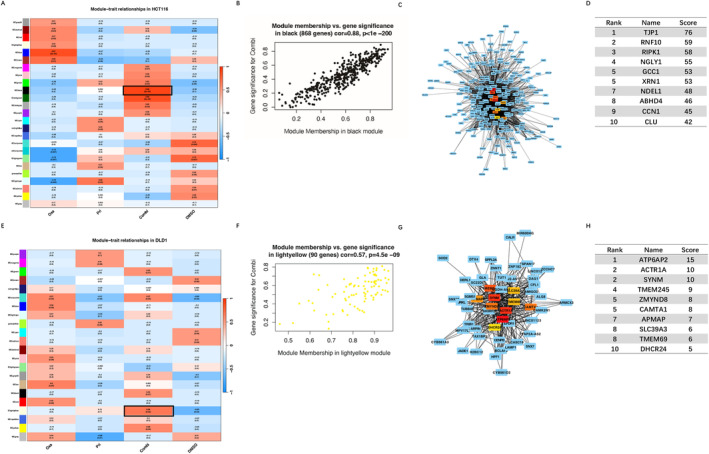
FIGURE 7.

(A) Heatmap of correlation between the module eigengenes and treatment modalities of HCT116 cells. The MEblack‐grade block, highlighted by a black rectangle, was selected for subsequent analysis. (B) Correlation of black module membership and gene significance in combination treated HCT116 group. (C) Interaction of gene co‐expression patterns in the black module of combination treated HCT116 group. The module was visualized using Cytoscape_3.10.1 software. (D) The top 10 hub genes identified the CytoHubba algorithms based on degree in the black module of combination treated HCT116 group. (E) Heatmap of the correlation between the module eigengenes and treatment modalities of DLD‐1 cells. The MEligthyellow‐grade block, highlighted by a black rectangle, was selected for subsequent analysis. (F) Correlation of light‐yellow module membership and gene significance in combination treated DLD‐1 group. (G) Interaction of gene co‐expression patterns in the light‐yellow module of combination treated DLD‐1 group. (H) The top 10 hub genes identified based on degree in the light‐yellow module of combination treated DLD‐1 group. ME, module eigengene; GS: gene significance; PRI: PRIMA‐1met; Oxa: oxaliplatin, L‐OHP; Combi: combination of PRI and Oxa.
