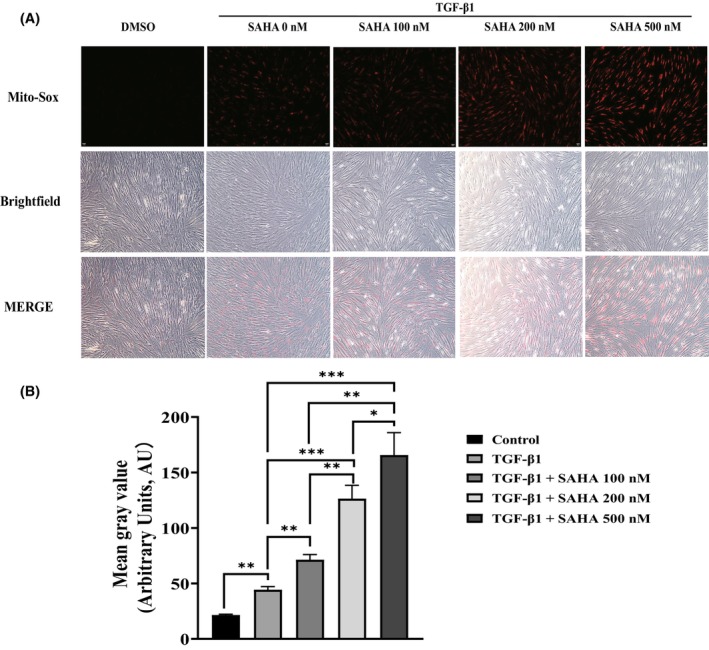
FIGURE 3.

SAHA increases mitochondrial ROS in MRC‐5 cells. (A) Fluorescence and bright‐field images of MRC‐5 cells treated with mito‐SOX red after exposure to TGF‐β1 and different concentrations of SAHA (n = 3). (B) Quantification of mean gray value of mito‐SOX (n = 3). The bars represent the mean ± SD of three separate experiments. * indicates p < 0.050, ** indicates p < 0.010, *** indicates p < 0.001.
