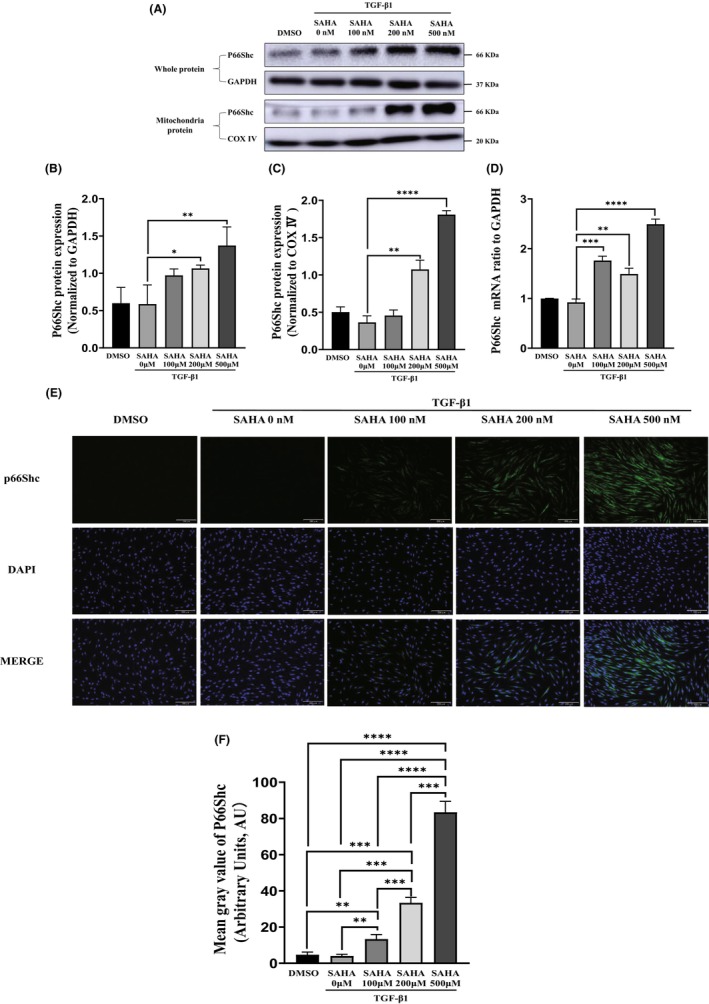
FIGURE 4.

SAHA increases the expression of p66Shc. (A, B, C, and D) Protein expression (both whole‐cell protein and mitochondrial protein) and mRNA expression of p66Shc in MRC‐5 cells treated with TGF‐β1 and different concentrations of SAHA (n = 3). (E, F) Immunofluorescence images and quantification of p66Shc (green) in MRC‐5 cells treated with TGF‐β1 and different concentrations of SAHA (n = 3). The bars represent the mean ± SD of three separate experiments. * indicates p < 0.050, ** indicates p < 0.010, *** indicates p < 0.001, **** indicates p < 0.0001.
