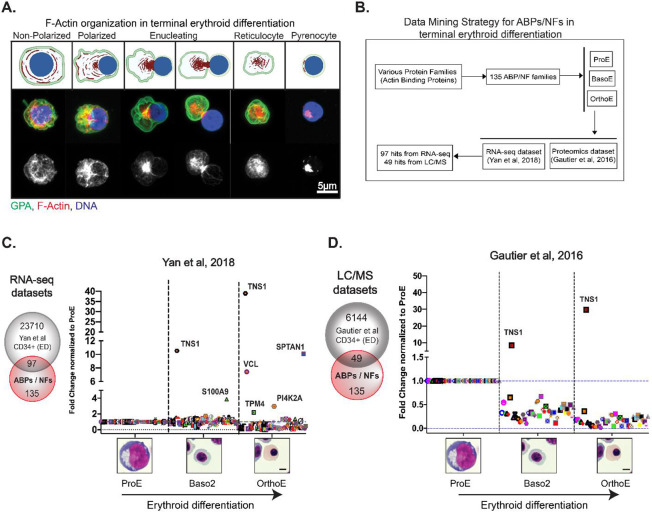
Figure 1: Database mining of actin-binding proteins and actin-nucleation factors reveals increased TNS1 expression during human terminal erythroid differentiation.
(A-top) Schematic of F-actin reorganization (red) into the enucleosome, GPA sorting to the reticulocyte (green), and nuclear expulsion (blue) during human erythroblast enucleation, created with BioRender.com (A-middle) Maximum intensity projection of Airyscan Z-stacks of human CD34+ cells prior to and during enucleation immunostained for GPA (green), F-actin (phalloidin; red), and nuclei (Hoechst; blue). (A-bottom) F-actin staining in gray scale shows the formation of the enucleosome at the rear of the nucleus. Scale bar, 5μm. (B) Flowchart representing the data mining strategy for 135 actin-binding proteins (ABPs) and actin-nucleation factors (NFs) to identify mRNAs and proteins that are up-regulated during terminal erythroid differentiation of CD34+ cells. Graphs showing fold change in expression of (C) 97 RNA-sequencing and (D) 49 proteomics hits during terminal erythroid differentiation. Values were plotted on a linear scale (converted from log2 fold change) and normalized to their respective expression level at the proerythroblast stage. Representative Giemsa-stained cytospin images for the human erythroblast stages included in bioinformatics analysis (ProE = proerythroblast; Baso2 = basophilic erythroblast; OrthoE = orthochromatic erythroblast). Scale bar, 5μm.

