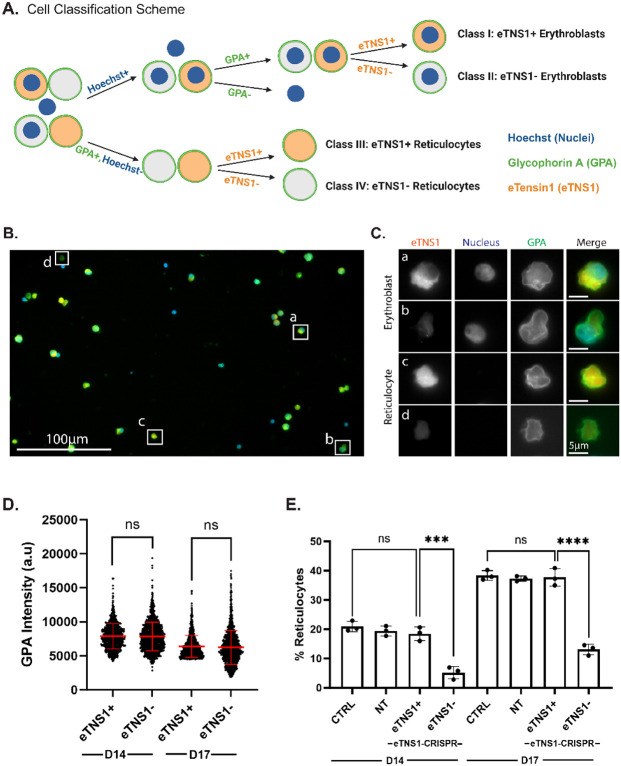
Figure 6: Single cell analysis reveals loss of eTNS1 impairs erythroblast enucleation.
(A) Schematic of erythroblast classification from eTNS1 knockout erythroid cultures into four categories based on Hoechst (Nuclei; blue), GPA (green), and eTNS1 (orange) staining. Cells were classified into eTNS1+ erythroblasts, eTNS1− erythroblasts, eTNS1+ reticulocytes, and eTNS1− reticulocytes. Schematic created with BioRender.com. (B) Representative single tiled image showing the heterogeneous cell population from an eTNS1 CRISPR KO culture using the Zeiss CellDiscoverer 7 (CD7). Scale bar, 100 μm. (C) Representative images of individual cells depicting the four classes: (a) eTNS1+ erythroblast, (b) eTNS1− erythroblast, (c) eTNS1+ reticulocyte, and (d) eTNS1− reticulocyte. Scale bar, 5 μm. (D) Quantification of GPA intensity levels of eTNS1+ and eTNS1− cells from day 14 and day 17 eTNS1 knockout cultures. 3-5 tiled images were taken from a single coverslip for each culture. Plot reflects the mean ± SD of 1500 eTNS1+ and eTNS1− erythroblasts from three independent eTNS1 knockout cultures. (E) Quantification of eTNS1− and eTNS1+ reticulocytes in control, non-target and knockout day 14 and day 17 cultures. % reticulocytes: (# of reticulocytes) / (# of reticulocytes + # of erythroblasts). Plot reflects mean ± SD of % reticulocytes calculated from ~6000 cells for each experiment. Three independent experiments performed for each condition. *** p=0.0002; **** p<0.0001.

