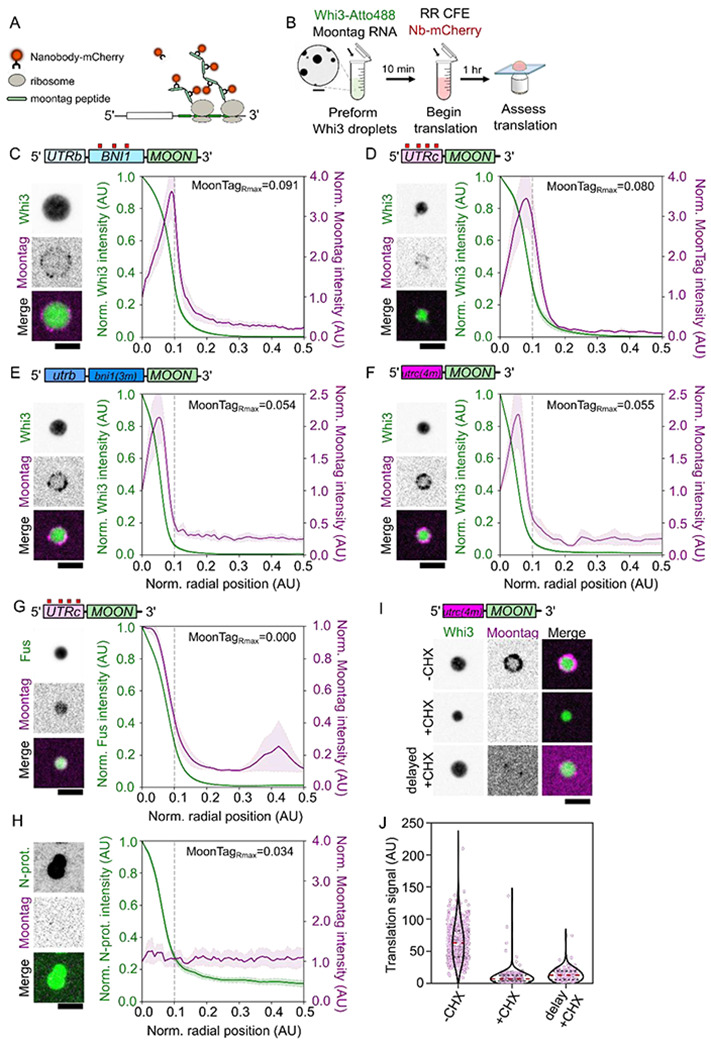
Figure 5. Condensate interfaces are sites for translation.

A. Design of MoonTag reporter mRNA.
B. Schematic of MoonTag reaction in cell extracts.
C. Fluorescence image of a Whi3 condensate formed with BNI1-Moon showing translation of mRNAs on the surface. Radial intensity profile of Whi3 condensates formed with BNI1-Moon, showing fluorescence intensity as a function of radial position in the condensate for Whi3 or MoonTag Nb-mCherry. The condensate periphery, grey line, is approximately 0.1 AU from the center of the condensate. The radial position associated with the maximum MoonTag intensity recorded, MoonTagRmax, is shown. Trace shows the average intensity of 123 condensates ± SEM. Scale bar = 2.5 μm.
D. Fluorescence images of Whi3 condensate formed with CLN3-Moon showing translation of mRNAs on the surface. Radial intensity profile of Whi3 condensates formed with CLN3-Moon, showing fluorescence intensity as a function of radial position in the condensate for Whi3 or MoonTag Nb-mCherry. The condensate periphery, grey line, is approximately 0.1 AU from the center of the condensate. The radial position associated with the maximum MoonTag intensity recorded, MoonTagRmax, is shown. Trace shows the average intensity of 42 condensates ± SEM. Scale bar = 2.5 μm.
E. Fluorescence images of Whi3 condensates formed with bni1(3m)-Moon showing translation of mRNAs at the condensate interface. Radial intensity profile of Whi3 condensates formed with bni1(3m)-Moon, showing fluorescence intensity as a function of radial position in the condensate for Whi3 and MoonTag Nb-mCherry. The condensate periphery, grey line, is approximately 0.1 AU from the center of the condensate. The radial position associated with the maximum MoonTag intensity recorded, MoonTagRmax, is shown. Trace shows the average intensity of 127 condensates ± SEM. Scale bar = 2.5 μm.
F. Fluorescence images of Whi3 condensates formed with cln3(4m)-Moon showing translation of mRNAs at the condensate interface. Radial intensity profile of Whi3 condensates formed with cln3(4m)-Moon, showing fluorescence intensity as a function of radial position in the condensate for Whi3 and MoonTag Nb-mCherry. The condensate periphery, grey line, is approximately 0.1 AU from the center of the condensate. The radial position associated with the maximum MoonTag intensity recorded, MoonTagRmax, is shown. Trace shows the average intensity of 147 condensates ± SEM. Scale bar = 2.5 μm.
G. Fluorescence images of Fus condensates formed with CLN3-Moon showing translation of mRNAs within the Fus condensate. Radial intensity profile of Fus condensates formed with CLN3-Moon, showing fluorescence intensity as a function of radial position in the condensate for Fus or MoonTag Nb-mCherry. Scale bar = 2.5 μm. The condensate periphery, grey line, is approximately 0.1 AU from the center of the condensate. The radial position associated with the maximum MoonTag intensity recorded, MoonTagRmax, is shown. Trace shows the average intensity of 265 condensates ± SEM.
H. Fluorescence images of N-protein condensates formed with CLN3-Moon showing no translation of mRNAs within or at the surface of the N-protein condensate. Radial intensity profile of N-protein condensates formed with CLN3-Moon, showing fluorescence intensity as a function of radial position in the condensate for N-protein or MoonTag Nb-mCherry. The condensate periphery, grey line, is approximately 0.1 AU from the center of the condensate. The radial position associated with the maximum MoonTag intensity recorded, MoonTagRmax, is shown. Trace shows the average intensity of 162 condensates ± SEM. Scale bar = 2.5 μm.
I. Fluorescence images showing translation of cln3(4m)-Moon at Whi3 condensates in RR lysates where translation is intact (−CHX), supplemented with cycloheximide (+CHX), or in lysates that have been allowed to translate CLN3-Moon mRNAs prior to either the addition of cycloheximide or Whi3 droplets (delayed +CHX). Scale bar = 2.5 μm.
J. Quantification of average translation signal per condensate in translation competent lysates (−CHX; n=460), lysates supplemented with cycloheximide (+CHX; n=253), or lysates that have first been allowed to translate CLN3(0xWBS)-Moon prior to the addition of either cycloheximide or Whi3 droplets (delayed +CHX; n=127). Measurements were taken from reactions prepared with three different RR lysates.
