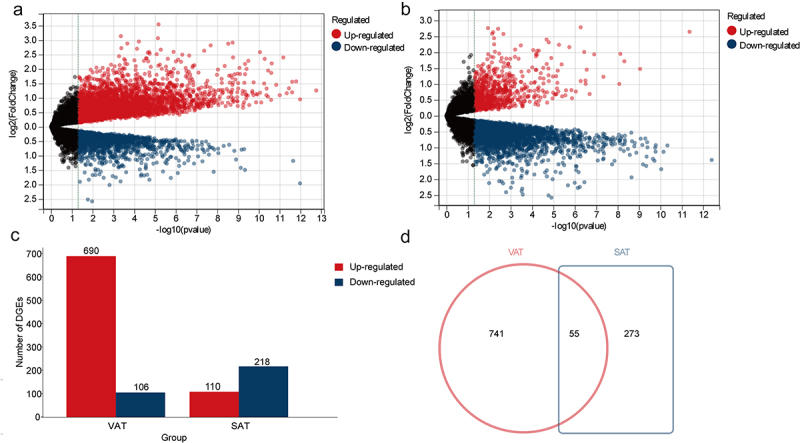
Figure 1.

To analyze the DEGs in SAT or VAT gene expression profiles of women with T2DM. (a) The volcanic plot illustrates the distribution of DEGs derived from comparing the gene expression profiles of VAT in women with T2DM (n = 12) versus those without T2DM (n = 12) (GSE 29231). (b) The volcanic plot illustrates the distribution of DEGs derived from comparing the gene expression profiles of women SAT in women with T2DM (n = 12) versus those without T2DM (n = 12) (GSE 29226). (c) The histogram presents the distribution and quantity of DEGs in VAT and SAT, with red indicating upregulated genes and blue indicating downregulated genes; (d) In the Venn diagram, the red circles represent DEGs specific to VAT, the blue rectangles represent DEGs specific to SAT, the overlapping areas indicate shared DEGs (n = 55), while the non-overlapping sections denote VAT-specific DEGs (n = 741) and SAT-specific DEGs (n = 273), respectively.
