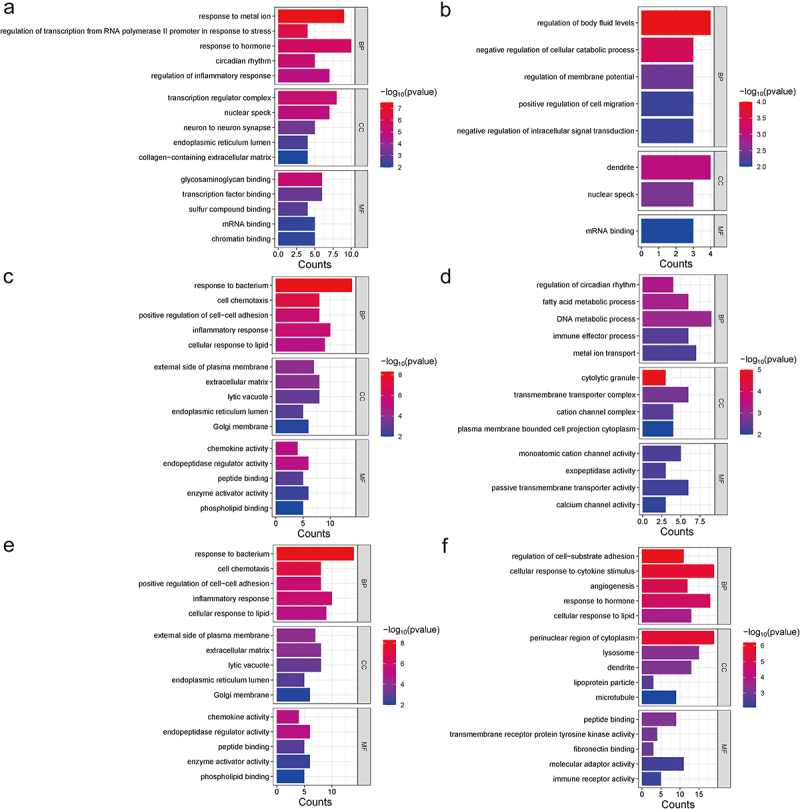
Figure 2.

Perform GO enrichment analysis of shared DEGs, VATspecific DEGs, and SAT-specific DEGs in women VAT and SAT gene expression profiles using metascape. Five GO enrichment results were displayed in each term for biological processes (BP), cellular components (CC), and molecular functions (MF) (if enough), with p < 0.01. (a) GO enrichment results of shared DEGs with the same expression trends in VAT and SAT(n = 37). (b) GO enrichment results of shared DEGs with the different expression trends (upregulated in one type and downregulated in the other at type) in VAT and SAT (n = 18). (c, d) GO enrichment analysis of DEGs with VAT-specific DEGs upregulation (n = 642) or downregulation (n = 99). (e, f) GO enrichment analysis of DEGs with SAT-specific DEGs upregulation (n = 78) or downregulation (n = 195).
