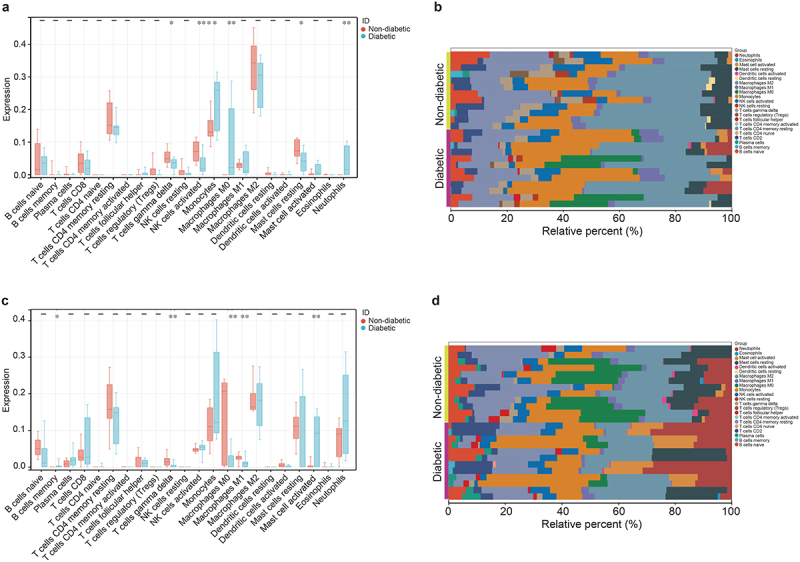
Figure 5.

Immunoinfiltration analysis of DEGs in 22 immune cell subtypes in women VAT and SAT using CIBERSORTx. (a, b) block diagram and cumulative histogram show the difference in immune cell infiltration in VAT between diabetes patients (n = 12) and non-diabetes patients (n = 12). (c, d) block diagram and cumulative histogram show the difference in immune cell infiltration in SAT between diabetes patients (n = 12) and non-diabetes patients (n = 12). *p < 0.05 **p < 0.01.
