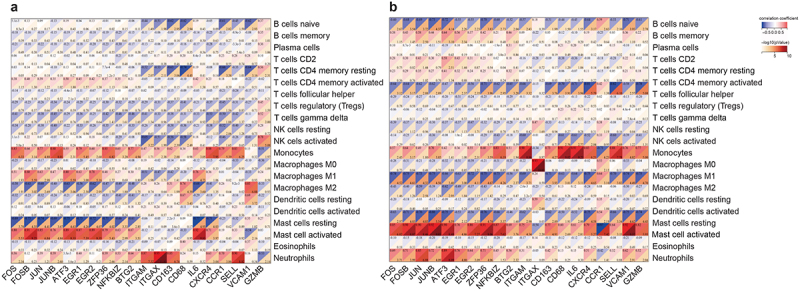
Figure 6.

Correlation matrix of infiltration degree of 22 immune cells and hub DEGs in women VAT and SAT using Sangerbox. Red represents a positive correlation, blue represents a negative correlation, and darker colors represent a stronger correlation. (a) Select the top 10 hub genes in shared DEGs and the top 10 hub genes in VAT-specific DEGs to generate a heatmap of their correlation with the degree of immune cell infiltration. (b) Select the top 10 hub genes in shared DEGs and the top 10 hub genes in SAT-specific DEGs to generate a heatmap of their correlation with the degree of immune cell infiltration.
