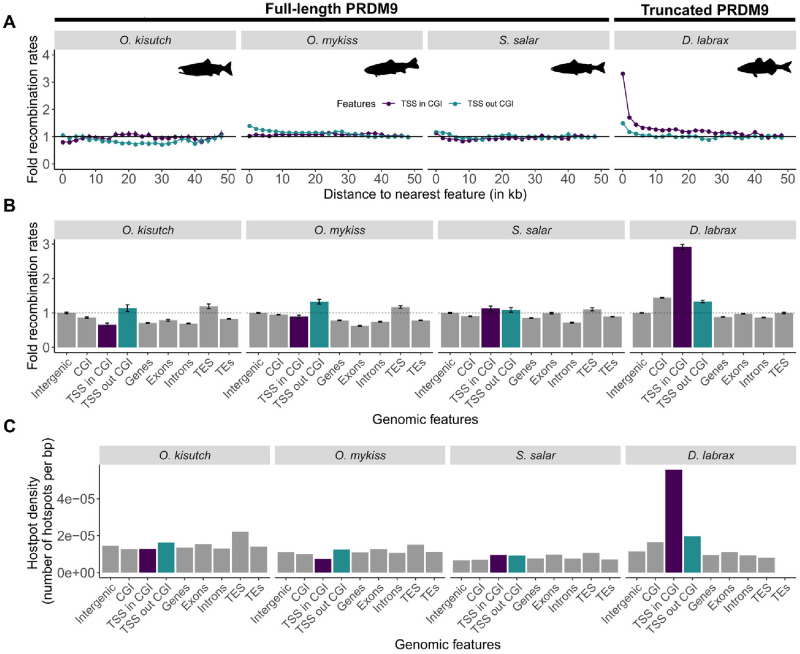
Fig 4. Recombination rates at genomic features.
The recombination rates at different genomic features are shown for O. kisutch, O. mykiss, and S. salar (NS population), and compared to those of sea bass (D. labrax) that lacks a full-length PRDM9 copy. (A) Fold recombination rates (scaled to the average recombination rate at 50 kb from the nearest feature) according to the distance to the nearest TSS (overlapping or not with a CGI). (B) Fold recombination rates (scaled to the average recombination rates in intergenic regions) at the indicated genomic features. (C) Hotspot density at the indicated genomic features. TSS in and out CGI are shown in purple and blue, respectively. The data and codes underlying this figure can be found in https://doi.org/10.5281/zenodo.11083953. NS, North Sea; TSS, transcription start site.

