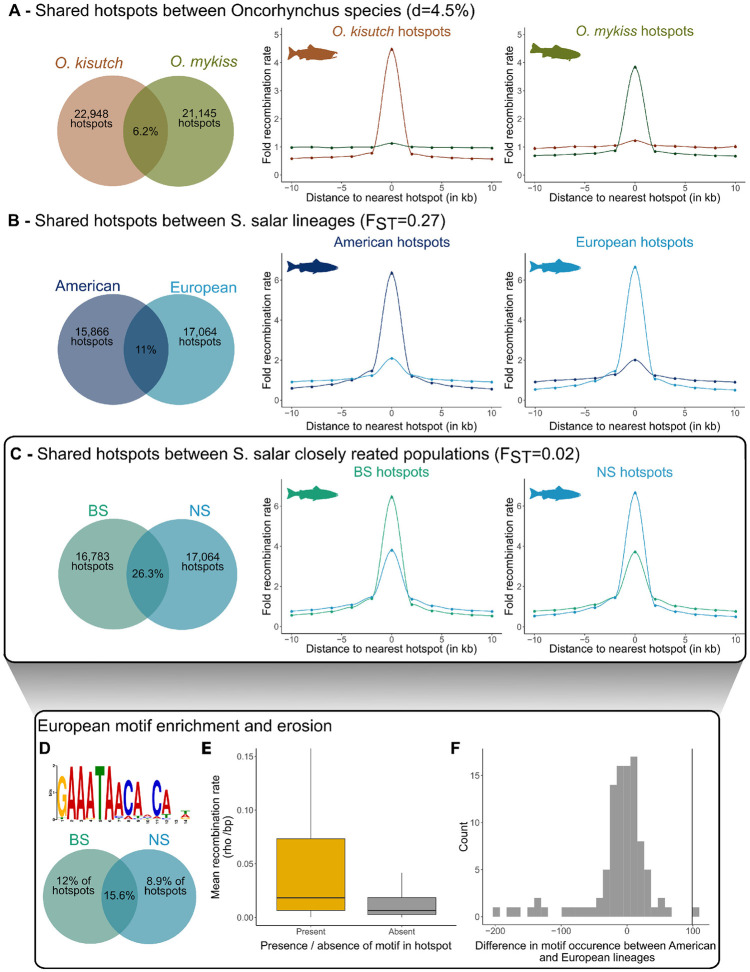
Fig 5. Recombination hotspots shared between populations and motif enrichment.
In panels (A–C), the Venn diagrams (left) show the percentages of recombination hotspots shared between pairs of taxa, and the graphs (middle and right) show the recombination rates around hotspots and at orthologous loci in the 2 taxa, for the 2 Oncorhynchus species (A), the American (GP population) and European (BS and NS populations) S. salar lineages (B), and between the 2 closely related European S. salar populations (BS and NS) (C). The percentage of shared hotspots was calculated using the number of hotspots in the population with fewer hotspots as the denominator. (D) Motif found enriched in the hotspots identified in the European populations of S. salar (BS and NS). The Venn diagram shows the percentages of population-specific and shared hotspots where the motif was found. (E) Mean recombination rate at shared hotspots (between the BS and NS populations) that harbor (n = 936 hotspots) or not (n = 3,485 hotspots) the detected motif. The recombination rate was significantly higher at hotspots with the motif (Student’s t test p-value <0.05). (F) Motif erosion in the European S. salar populations. The vertical line represents the observed difference in the occurrence of the motif in panel D between the American and European lineages. The null distribution (in gray) shows the difference for 100 random permutations of the motif. The data and codes underlying this figure can be found in https://doi.org/10.5281/zenodo.11083953. BS, Barents Sea; GP, Gaspesie Peninsula; NS, North Sea.

