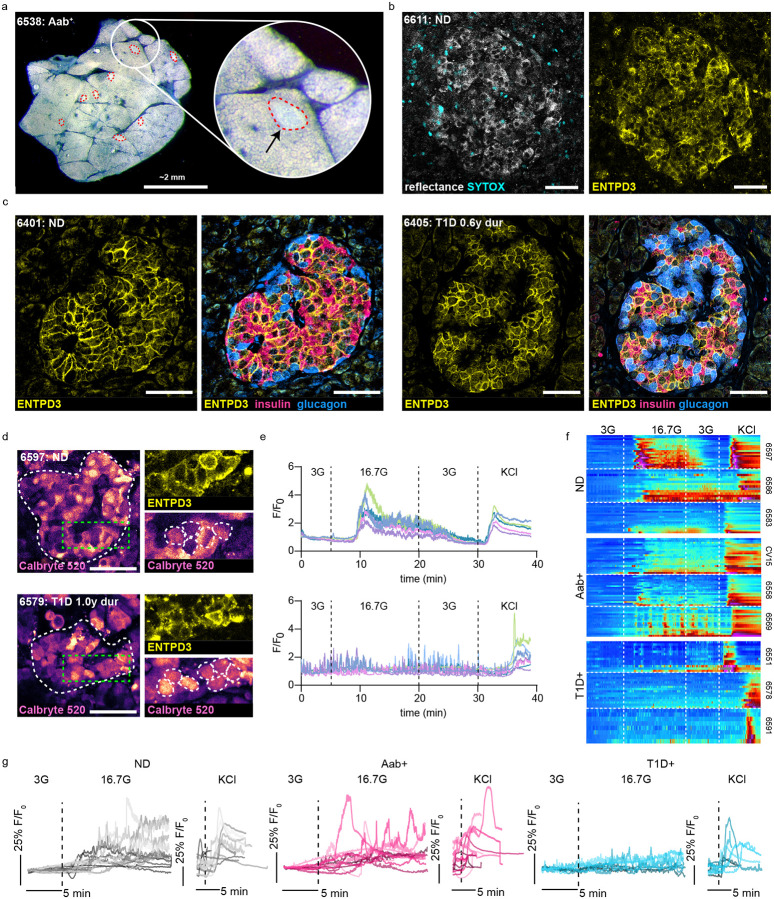
Figure 1:
ENTPD3 staining identifies beta cells in live pancreas tissue slices from ND and T1D+ donors. a) Darkfield stereomicroscopy image of a live human pancreas tissue slice with islets outlined in red. b) Confocal image of an islet within a live slice indicated by reflected light and ENTPD3. Dead cells are indicated by SYTOX staining. c) Fixed tissue staining of FFPE human pancreas tissue sections showing ENTPD3 positive cells co-localize with insulin positive cells and not glucagon positive cells in both ND and T1D+ cases. d) Reflective and ENTPD3 positive islets within ND and T1D+ slices outlined in red. Still frames of Ca2+ responses to high glucose (16.7G) of the same islets outlined in white (middle). Magnified regions outlined in green within these islets showing individual ENTPD3+ cells, outlined in white. e) Heatmaps depicting representative islet Ca2+ responses to low glucose (3 mM), high glucose (16.7 mM), and KCl (30 mM) in three donors from ND, Aab+, and T1D+ cases. Each column represents the Ca2+ response in an individual ENTPD3+ cell. f) Traces of the mean islet Ca2+ response from all recorded ND (n=14), Aab+ (n=11), and T1D+ cases (n=9).Scale bars, 50 μm.

